3D Mapping and Modeling Market Size, Share, Growth Analysis, By Offering:(Software, 3D Mapping Software, 3D Projection Mapping, GIS Mapping), By Technology:(LiDAR, Photogrammetry, Structured Light Scanning, SLAM), By Software Deployment Mode:(Cloud, On-premises), By Vertical:(Architecture, Engineering & Construction (AEC), Manufacturing, Automotive & Transportation), By Region:(North America, US, Canada, Europe) - Industry Forecast 2024-2031


Report ID: UCMIG45E2223 | Region: Global | Published Date: Upcoming |
Pages: 165 |Tables: 0 |Figures: 0

3D Mapping and Modeling Market Insights

Market Overview:

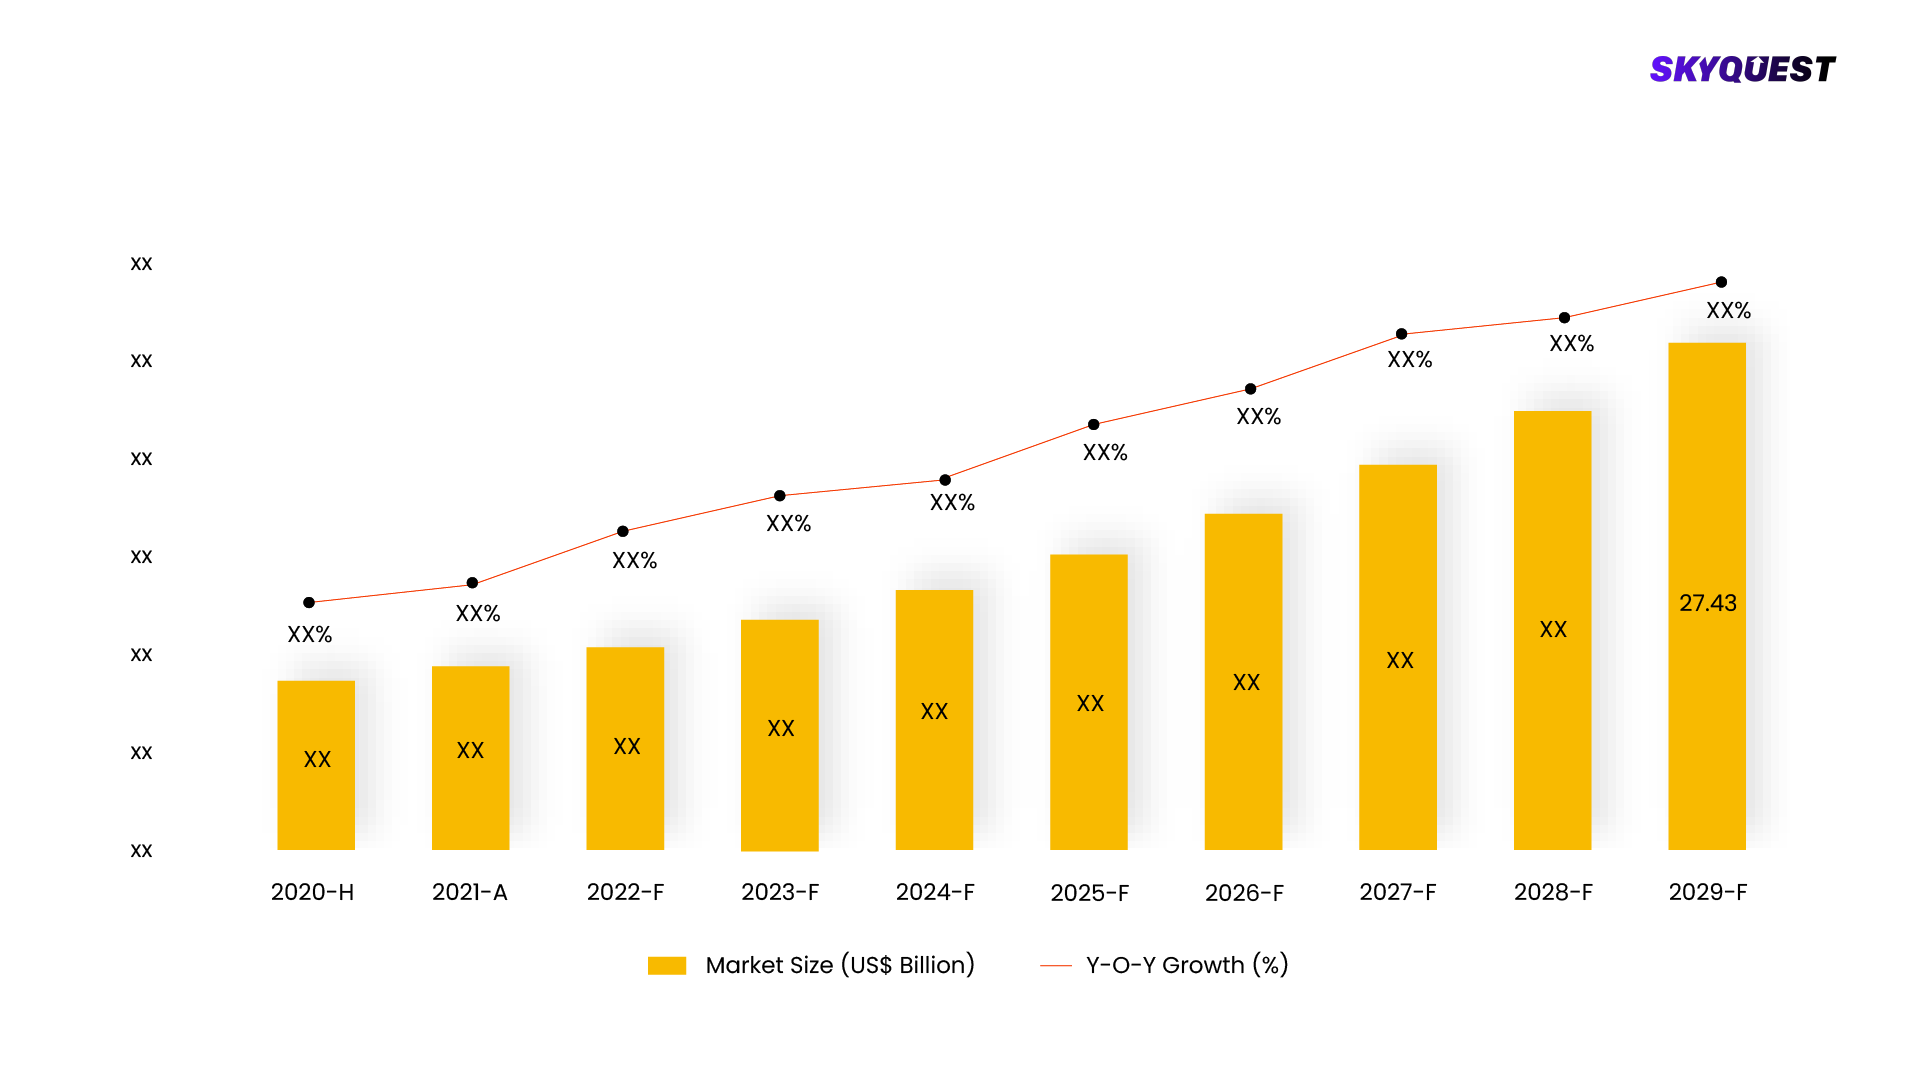
By 2028, the market for 3D mapping and modeling is anticipated to have grown from USD 5.4 billion in 2023 to USD 11.8 billion, at a compound annual growth rate (CAGR) of 17.2%. The key factors driving this industry are the increasing demand for 3D animation across mobile applications, games, and movies for an enhanced viewing experience, technological advancements in 3D scanners, 3D sensors, and other acquisition devices, expanding availability of 3D content, and the introduction of 3D-enabled display devices for a better navigation experience.

3D Mapping and Modeling Market, Forecast & Y-O-Y Growth Rate, 2020 - 2028
ForecastGrowthRate
To get more reports on the above market click here to
GET FREE SAMPLE

This report is being written to illustrate the market opportunity by region and by segments, indicating opportunity areas for the vendors to tap upon. To estimate the opportunity, it was very important to understand the current market scenario and the way it will grow in future.

Production and consumption patterns are being carefully compared to forecast the market. Other factors considered to forecast the market are the growth of the adjacent market, revenue growth of the key market vendors, scenario-based analysis, and market segment growth.

The market size was determined by estimating the market through a top-down and bottom-up approach, which was further validated with industry interviews. Considering the nature of the market we derived the Application Software by segment aggregation, the contribution of the Application Software in Software & Services and vendor share.

To determine the growth of the market factors such as drivers, trends, restraints, and opportunities were identified, and the impact of these factors was analyzed to determine the market growth. To understand the market growth in detail, we have analyzed the year-on-year growth of the market. Also, historic growth rates were compared to determine growth patterns.

Segmentation Analysis:

The 3D Mapping and Modeling Market is segmented by Offering:, Technology:, Software Deployment Mode:, Vertical:, Region:. We are analyzing the market of these segments to identify which segment is the largest now and in the future, which segment has the highest growth rate, and the segment which offers the opportunity in the future.

3D Mapping and Modeling Market Basis Point Share Analysis, 2021 Vs. 2028
BasisPointShareAnalysis
To get detailed analysis on all segments
BUY NOW
  • Based on Offering: the market is segmented as, Software, 3D Mapping Software, 3D Projection Mapping, GIS Mapping, Drone Mapping, Satellite and Aerial Imaging, Other 3D Mapping Software, 3D Modeling Software, Solid Modeling, Wireframe Modeling, Surface Modeling, Other 3D Modeling Software, Services, Professional Services, Training & Consulting, System Integration & Implementation, Support & Maintenance, Managed Services
  • Based on Technology: the market is segmented as, LiDAR, Photogrammetry, Structured Light Scanning, SLAM, Other Technologies
  • Based on Software Deployment Mode: the market is segmented as, Cloud, On-premises
  • Based on Vertical: the market is segmented as, Architecture, Engineering & Construction (AEC), Manufacturing, Automotive & Transportation, Healthcare & Life Sciences, Media & Entertainment, Government & Defense, Education, Agriculture, Energy & Utilities, Other Verticals
  • Based on Region: the market is segmented as, North America, US, Canada, Europe, UK, Germany, France, Italy, Spain, Rest of Europe, Asia Pacific, China, India, Japan, Australia and New Zealand (ANZ), South Korea, ASEAN Countries, Rest of Asia Pacific, Middle East & Africa, UAE, Saudi Arabia, South Africa, Israel, Egypt, Rest of the Middle East & Africa, Latin America, Brazil, Mexico, Argentina, Rest of Latin America, KEY MARKET PLAYERS, Google, Autodesk, Trimble, Bentley Systems, Dassault Systemes, Adobe, Hexagon, Esri, Golden Software, Maxon, Topcon, CyberCity 3D, Pix4D, Apple, Onionlab, Mapbox, Saab AB, Airbus, Intermap Technologies, The Foundry Visionmongers, PTC, MathWorks, Ansys, Blender Foundation, SideFX, Civil Maps, Hivemapper, lvl5, Shapr3D, Innersight, Astrivis Technologies, Pointivo, Dynamic Map Platform, Archilogic, MOD Tech Labs

Regional Analysis:

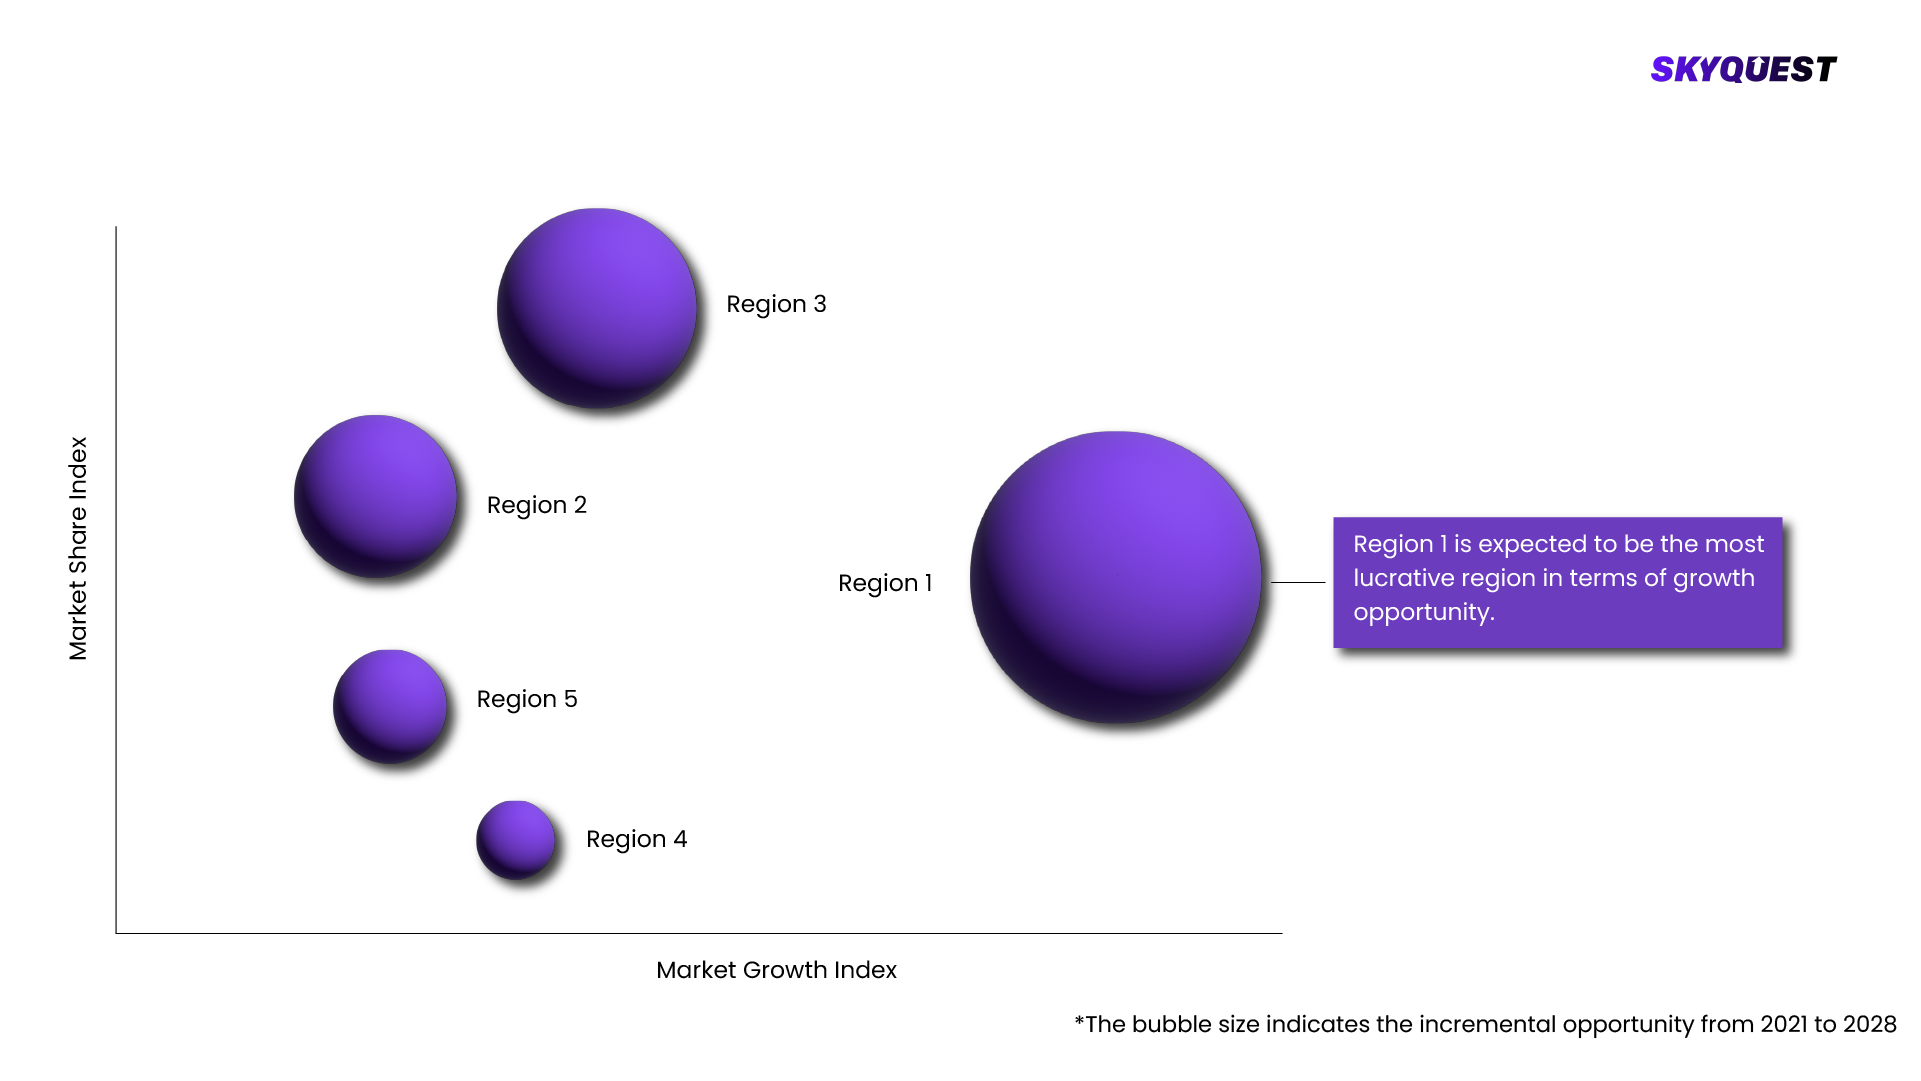
3D Mapping and Modeling Market is being analyzed by North America, Europe, Asia-Pacific (APAC), Latin America (LATAM), Middle East & Africa (MEA) regions. Key countries including the U.S., Canada, Germany, France, UK, Italy, Spain, China, India, Japan, Brazil, GCC Countries, and South Africa among others were analyzed considering various micro and macro trends.

3D Mapping and Modeling Market Attractiveness Analysis, By Region 2020-2028
AttractivenessAnalysis
To know more about the market opportunities by region and country, click here to
REQUEST FREE CUSTOMIZATION

3D Mapping and Modeling Market : Risk Analysis

SkyQuest's expert analysts have conducted a risk analysis to understand the impact of external extremities on 3D Mapping and Modeling Market. We analyzed how geopolitical influence, natural disasters, climate change, legal scenario, economic impact, trade & economic policies, social & ethnic concerns, and demographic changes might affect 3D Mapping and Modeling Market's supply chain, distribution, and total revenue growth.

Competitive landscaping:

To understand the competitive landscape, we are analyzing key 3D Mapping and Modeling Market vendors in the market. To understand the competitive rivalry, we are comparing the revenue, expenses, resources, product portfolio, region coverage, market share, key initiatives, product launches, and any news related to the 3D Mapping and Modeling Market.

To validate our hypothesis and validate our findings on the market ecosystem, we are also conducting a detailed porter's five forces analysis. Competitive Rivalry, Supplier Power, Buyer Power, Threat of Substitution, and Threat of New Entry each force is analyzed by various parameters governing those forces.

Key Players Covered in the Report:

  • ing and modeling market is projected to grow from USD 5.4 billion in 2023 to USD 11.8 billion by 2028, at a compound annual growth rate (CAGR) of 17.2% during the forecast period. Due to various business drivers, the 3D mapping and modeling market is expected to grow significantly during the forecast period. The market is experiencing significant growth as the demand for 3D animation across mobile applications and technological advancements in 3D scanners, 3D sensors, and other acquisition devices is growing. The growing availability of 3D content and the advent of 3D-enabled display devices for a better navigation experience is also responsible for driving the market’s growth.
  • Market Dynamics
  • Driver: Advent of 3D-enabled display devices for a better navigation experience
  • Advancements in 3D maps are expected to be driven by the increasing need for an HD experience among users. 3D viewing technology has been available in the market for many years, but the quality delivered to the consumer was inadequate. Consumers always need the best viewing experience of perceived 3D images, similar to what objects look like. Innovative technologies have already started setting foot in the market, which gives users a comfortable HD viewing experience. They provide images of objects that look real and have adequate details. 3D mapping and 3D modeling technologies enable users to have real-life experiences of the surrounding buildings and terrain by viewing them through 3D-enabled devices, such as smartphones, tablets, and Personal Computers (PCs). The demand for 3D-enabled devices is expected to increase in the years to come. According to the statistics, the demand for all 3D-enabled devices is predicted to increase due to technological advancements, changing lifestyles, and the rising awareness among people regarding these advanced devices. Moreover, the increasing need for crisp and realistic image visualization, superior 3D effects, and an excellent mapping and navigation experience are driving the 3D mapping and 3D modeling market.
  • Restraints: Increasing corruption and piracy concerns
  • The animation industry continues to be exposed to corruption and piracy risks. The software installation of companies is targeted, and pirated copies are sold in the market. Consequently, the industry suffers huge financial losses. To control piracy, companies have developed surveillance and monitoring programs to inhibit the illegal downloading of 3D mapping and modeling software. This, in turn, has encouraged users to use legal digital content. In recent years, government norms and regulatory reforms have been implemented to mitigate piracy threats. However, there is a need to adopt flexible business plans to develop mitigation strategies and undertake proactive measures by forming anti-piracy cells and spreading awareness. For instance, in India, states such as Tamil Nadu and Maharashtra have taken initiatives to spread public awareness against piracy. However, in various countries, the only regulatory policy to prevent piracy is to block sites and impose a penalty on illegal users. According to statistics by DataProt, Software piracy rates worldwide dropped to 37% in 2017, down by 2% from two years earlier.
  • Opportunity: Integration with IoT and sensor technologies for real-time data collection and visualization
  • The integration of 3D mapping and modeling solutions with Internet of Things (IoT) and sensor technologies enables real-time data collection and visualization, leading to a host of benefits and applications across various industries. IoT devices and sensors gather real-time data from physical objects, equipment, and environments. These devices can capture a wide range of data, including temperature, humidity, pressure, motion, location, etc. By integrating 3D mapping and modeling solutions with IoT devices, businesses can collect vast amounts of data continuously and in real time. 3D mapping and modeling solutions provide a powerful platform for visualizing complex data from IoT devices. Instead of traditional 2D charts and graphs, 3D visualizations enable users to understand data spatially, identifying patterns, trends, and anomalies more effectively. Businesses gain enhanced situational awareness by combining IoT sensor data with 3D mapping and modeling. For example, in smart cities, sensors can monitor traffic flow, air quality, and waste management, and 3D visualizations allow city administrators to make data-driven decisions to optimize city services. Integrating 3D mapping and modeling solutions with IoT and sensor technologies presents a vast array of applications across industries. By leveraging real-time data visualization and analytics, businesses and organizations can make more informed decisions, optimize processes, improve safety, and unlock new levels of efficiency and innovation. As the IoT ecosystem continues to grow, the demand for such integrated solutions is expected to increase significantly.
  • Challenge: Stringent government regulations and lack of investments
  • The lack of capital investment hinders the growth of the 3D mapping and modeling market. Insufficient fund supply restricts R&D activities, training manpower, and purchasing innovative technologies. Investments in adopting the latest technologies ensure the work system efficiency and increase the number of opportunities for the industry. One major reason for low investor attraction is the slow Return on Investment (ROI) in the animation industry. As a result, private investors are reluctant to enter the 3D mapping and modeling market. Regarding government support, countries like the US, China, Taiwan, Singapore, and Japan provide significant development provisions to boost market growth.
  • By offering, solutions segment to account for a larger market size during forecast period
  • The 3D mapping and modeling solutions include 3D mapping and modeling software. 3D mapping and modeling solutions comprise a set of technologies, software, and tools that enable the creation, visualization, and manipulation of three-dimensional (3D) representations of real-world objects, landscapes, environments, or virtual entities. These solutions are used in various industries and applications to generate accurate, detailed, and interactive 3D models, which provide valuable insights, support decision-making processes, and enhance user experiences. These solutions offer various visualization methods, such as 3D rendering, animation, and interactive user interfaces, to represent the 3D data and models comprehensibly and informally.
  • By technology, photogrammetry registers the highest CAGR during the forecast period
  • The photogrammetry segment is projected to grow more during the forecast period. Photogrammetry is a cutting-edge technology making significant strides in 3D mapping and modeling. It involves capturing accurate 3D data from 2D images, enabling the creation of detailed and realistic 3D models of real-world objects and environments. As technology advances, photogrammetry applications have expanded, leading to a growing demand for this innovative solution in various industries.
  • By region, North America holds the largest market size during the forecast period
  • North America will lead the 3D mapping and modeling market in 2023. North America, comprising the United States and Canada, is known for its advanced technology infrastructure and innovative industries, making it a hub for adopting 3D mapping and modeling technologies. In addition, North America is home to the gaming and entertainment industry, and 3D mapping and modeling solutions play a crucial role in creating visually stunning and realistic gaming environments. The adoption of 3D mapping and modeling solutions in North America is likely to continue growing as these technologies advance and find new applications in various industries. The region's strong technology ecosystem and continuous innovation make it a key player in driving the development and adoption of these solutions globally.
  • Recent Developments:
  • In June 2023, Dassault Systemes advanced the portfolio transformation of its GEOVIA mining software solutions to integrate them into its 3DEXPERIENCE platform.
  • In May 2023, Trimble announced the latest version of Trimble Business Center includes enhancements for CenterPoint RTX corrections, mobile mapping, comparing TBC + TRW for scanning.
  • In April 2023, Trimble and the University of Applied Sciences and Arts Northwestern Switzerland FHNW have collaborated to establish a state-of-the-art Trimble Technology Lab at FHNW's School of Architecture, Civil Engineering and Geomatics program in Muttenz, Switzerland.
  • In February 2023, Bentley’s acquisition of EasyPower, to extend integrated and iterative power systems design and analysis for infrastructure digital twins of every type, broadens its comprehensiveness in infrastructure engineering.
  • In Sptember 2022, Autodesk announced a strategic collaboration with Epic Games to accelerate immersive real-time (RT) experiences across industries, with an initial focus on Architecture, Engineering and Construction (AEC).
  • In July 2022, Google has announced a partnership with Genesys International and Tech Mahindra. This new integration of street view into Google Maps offers users to access the up-to-date imagery sourced data from local partners.
  • KEY MARKET SEGMENTS
  • By Offering:
  • Software
  • 3D Mapping Software
  • 3D Projection Mapping
  • GIS Mapping
  • Drone Mapping
  • Satellite and Aerial Imaging
  • Other 3D Mapping Software
  • 3D Modeling Software
  • Solid Modeling
  • Wireframe Modeling
  • Surface Modeling
  • Other 3D Modeling Software
  • Services
  • Professional Services
  • Training & Consulting
  • System Integration & Implementation
  • Support & Maintenance
  • Managed Services
  • By Technology:
  • LiDAR
  • Photogrammetry
  • Structured Light Scanning
  • SLAM
  • Other Technologies
  • Software By Deployment Mode:
  • Cloud
  • On-premises
  • By Vertical:
  • Architecture, Engineering & Construction (AEC)
  • Manufacturing
  • Automotive & Transportation
  • Healthcare & Life Sciences
  • Media & Entertainment
  • Government & Defense
  • Education
  • Agriculture
  • Energy & Utilities
  • Other Verticals
  • By Region:
  • North America
  • US
  • Canada
  • Europe
  • UK
  • Germany
  • France
  • Italy
  • Spain
  • Rest of Europe
  • Asia Pacific
  • China
  • India
  • Japan
  • Australia and New Zealand (ANZ)
  • South Korea
  • ASEAN Countries
  • Rest of Asia Pacific
  • Middle East & Africa
  • UAE
  • Saudi Arabia
  • South Africa
  • Israel
  • Egypt
  • Rest of the Middle East & Africa
  • Latin America
  • Brazil
  • Mexico
  • Argentina
  • Rest of Latin America
  • KEY MARKET PLAYERS
  • Google
  • Autodesk
  • Trimble
  • Bentley Systems
  • Dassault Systemes
  • Adobe
  • Hexagon
  • Esri
  • Golden Software
  • Maxon
  • Topcon
  • CyberCity 3D
  • Pix4D
  • Apple
  • Onionlab
  • Mapbox
  • Saab AB
  • Airbus
  • Intermap Technologies
  • The Foundry Visionmongers
  • PTC
  • MathWorks
  • Ansys
  • Blender Foundation
  • SideFX
  • Civil Maps
  • Hivemapper
  • lvl5
  • Shapr3D
  • Innersight
  • Astrivis Technologies
  • Pointivo
  • Dynamic Map Platform
  • Archilogic
  • MOD Tech Labs

SkyQuest's Expertise:

The 3D Mapping and Modeling Market is being analyzed by SkyQuest's analysts with the help of 20+ scheduled Primary interviews from both the demand and supply sides. We have already invested more than 250 hours on this report and are still refining our date to provide authenticated data to your readers and clients. Exhaustive primary and secondary research is conducted to collect information on the market, peer market, and parent market.

Our cross-industry experts and revenue-impact consultants at SkyQuest enable our clients to convert market intelligence into actionable, quantifiable results through personalized engagement.

Scope Of Report

Report Attribute Details
The base year for estimation 2021
Historical data 2016 – 2022
Forecast period 2022 – 2028
Report coverage Revenue forecast, volume forecast, company ranking, competitive landscape, growth factors, and trends, Pricing Analysis
Segments covered
  • By Offering: - Software, 3D Mapping Software, 3D Projection Mapping, GIS Mapping, Drone Mapping, Satellite and Aerial Imaging, Other 3D Mapping Software, 3D Modeling Software, Solid Modeling, Wireframe Modeling, Surface Modeling, Other 3D Modeling Software, Services, Professional Services, Training & Consulting, System Integration & Implementation, Support & Maintenance, Managed Services
  • By Technology: - LiDAR, Photogrammetry, Structured Light Scanning, SLAM, Other Technologies
  • By Software Deployment Mode: - Cloud, On-premises
  • By Vertical: - Architecture, Engineering & Construction (AEC), Manufacturing, Automotive & Transportation, Healthcare & Life Sciences, Media & Entertainment, Government & Defense, Education, Agriculture, Energy & Utilities, Other Verticals
  • By Region: - North America, US, Canada, Europe, UK, Germany, France, Italy, Spain, Rest of Europe, Asia Pacific, China, India, Japan, Australia and New Zealand (ANZ), South Korea, ASEAN Countries, Rest of Asia Pacific, Middle East & Africa, UAE, Saudi Arabia, South Africa, Israel, Egypt, Rest of the Middle East & Africa, Latin America, Brazil, Mexico, Argentina, Rest of Latin America, KEY MARKET PLAYERS, Google, Autodesk, Trimble, Bentley Systems, Dassault Systemes, Adobe, Hexagon, Esri, Golden Software, Maxon, Topcon, CyberCity 3D, Pix4D, Apple, Onionlab, Mapbox, Saab AB, Airbus, Intermap Technologies, The Foundry Visionmongers, PTC, MathWorks, Ansys, Blender Foundation, SideFX, Civil Maps, Hivemapper, lvl5, Shapr3D, Innersight, Astrivis Technologies, Pointivo, Dynamic Map Platform, Archilogic, MOD Tech Labs
Regional scope North America, Europe, Asia-Pacific (APAC), Latin America (LATAM), Middle East & Africa (MEA)
Country scope U.S., Canada, Germany, France, UK, Italy, Spain, China, India, Japan, Brazil, GCC Countries, South Africa
Key companies profiled
  • ing and modeling market is projected to grow from USD 5.4 billion in 2023 to USD 11.8 billion by 2028, at a compound annual growth rate (CAGR) of 17.2% during the forecast period. Due to various business drivers, the 3D mapping and modeling market is expected to grow significantly during the forecast period. The market is experiencing significant growth as the demand for 3D animation across mobile applications and technological advancements in 3D scanners, 3D sensors, and other acquisition devices is growing. The growing availability of 3D content and the advent of 3D-enabled display devices for a better navigation experience is also responsible for driving the market’s growth.
  • Market Dynamics
  • Driver: Advent of 3D-enabled display devices for a better navigation experience
  • Advancements in 3D maps are expected to be driven by the increasing need for an HD experience among users. 3D viewing technology has been available in the market for many years, but the quality delivered to the consumer was inadequate. Consumers always need the best viewing experience of perceived 3D images, similar to what objects look like. Innovative technologies have already started setting foot in the market, which gives users a comfortable HD viewing experience. They provide images of objects that look real and have adequate details. 3D mapping and 3D modeling technologies enable users to have real-life experiences of the surrounding buildings and terrain by viewing them through 3D-enabled devices, such as smartphones, tablets, and Personal Computers (PCs). The demand for 3D-enabled devices is expected to increase in the years to come. According to the statistics, the demand for all 3D-enabled devices is predicted to increase due to technological advancements, changing lifestyles, and the rising awareness among people regarding these advanced devices. Moreover, the increasing need for crisp and realistic image visualization, superior 3D effects, and an excellent mapping and navigation experience are driving the 3D mapping and 3D modeling market.
  • Restraints: Increasing corruption and piracy concerns
  • The animation industry continues to be exposed to corruption and piracy risks. The software installation of companies is targeted, and pirated copies are sold in the market. Consequently, the industry suffers huge financial losses. To control piracy, companies have developed surveillance and monitoring programs to inhibit the illegal downloading of 3D mapping and modeling software. This, in turn, has encouraged users to use legal digital content. In recent years, government norms and regulatory reforms have been implemented to mitigate piracy threats. However, there is a need to adopt flexible business plans to develop mitigation strategies and undertake proactive measures by forming anti-piracy cells and spreading awareness. For instance, in India, states such as Tamil Nadu and Maharashtra have taken initiatives to spread public awareness against piracy. However, in various countries, the only regulatory policy to prevent piracy is to block sites and impose a penalty on illegal users. According to statistics by DataProt, Software piracy rates worldwide dropped to 37% in 2017, down by 2% from two years earlier.
  • Opportunity: Integration with IoT and sensor technologies for real-time data collection and visualization
  • The integration of 3D mapping and modeling solutions with Internet of Things (IoT) and sensor technologies enables real-time data collection and visualization, leading to a host of benefits and applications across various industries. IoT devices and sensors gather real-time data from physical objects, equipment, and environments. These devices can capture a wide range of data, including temperature, humidity, pressure, motion, location, etc. By integrating 3D mapping and modeling solutions with IoT devices, businesses can collect vast amounts of data continuously and in real time. 3D mapping and modeling solutions provide a powerful platform for visualizing complex data from IoT devices. Instead of traditional 2D charts and graphs, 3D visualizations enable users to understand data spatially, identifying patterns, trends, and anomalies more effectively. Businesses gain enhanced situational awareness by combining IoT sensor data with 3D mapping and modeling. For example, in smart cities, sensors can monitor traffic flow, air quality, and waste management, and 3D visualizations allow city administrators to make data-driven decisions to optimize city services. Integrating 3D mapping and modeling solutions with IoT and sensor technologies presents a vast array of applications across industries. By leveraging real-time data visualization and analytics, businesses and organizations can make more informed decisions, optimize processes, improve safety, and unlock new levels of efficiency and innovation. As the IoT ecosystem continues to grow, the demand for such integrated solutions is expected to increase significantly.
  • Challenge: Stringent government regulations and lack of investments
  • The lack of capital investment hinders the growth of the 3D mapping and modeling market. Insufficient fund supply restricts R&D activities, training manpower, and purchasing innovative technologies. Investments in adopting the latest technologies ensure the work system efficiency and increase the number of opportunities for the industry. One major reason for low investor attraction is the slow Return on Investment (ROI) in the animation industry. As a result, private investors are reluctant to enter the 3D mapping and modeling market. Regarding government support, countries like the US, China, Taiwan, Singapore, and Japan provide significant development provisions to boost market growth.
  • By offering, solutions segment to account for a larger market size during forecast period
  • The 3D mapping and modeling solutions include 3D mapping and modeling software. 3D mapping and modeling solutions comprise a set of technologies, software, and tools that enable the creation, visualization, and manipulation of three-dimensional (3D) representations of real-world objects, landscapes, environments, or virtual entities. These solutions are used in various industries and applications to generate accurate, detailed, and interactive 3D models, which provide valuable insights, support decision-making processes, and enhance user experiences. These solutions offer various visualization methods, such as 3D rendering, animation, and interactive user interfaces, to represent the 3D data and models comprehensibly and informally.
  • By technology, photogrammetry registers the highest CAGR during the forecast period
  • The photogrammetry segment is projected to grow more during the forecast period. Photogrammetry is a cutting-edge technology making significant strides in 3D mapping and modeling. It involves capturing accurate 3D data from 2D images, enabling the creation of detailed and realistic 3D models of real-world objects and environments. As technology advances, photogrammetry applications have expanded, leading to a growing demand for this innovative solution in various industries.
  • By region, North America holds the largest market size during the forecast period
  • North America will lead the 3D mapping and modeling market in 2023. North America, comprising the United States and Canada, is known for its advanced technology infrastructure and innovative industries, making it a hub for adopting 3D mapping and modeling technologies. In addition, North America is home to the gaming and entertainment industry, and 3D mapping and modeling solutions play a crucial role in creating visually stunning and realistic gaming environments. The adoption of 3D mapping and modeling solutions in North America is likely to continue growing as these technologies advance and find new applications in various industries. The region's strong technology ecosystem and continuous innovation make it a key player in driving the development and adoption of these solutions globally.
  • Recent Developments:
  • In June 2023, Dassault Systemes advanced the portfolio transformation of its GEOVIA mining software solutions to integrate them into its 3DEXPERIENCE platform.
  • In May 2023, Trimble announced the latest version of Trimble Business Center includes enhancements for CenterPoint RTX corrections, mobile mapping, comparing TBC + TRW for scanning.
  • In April 2023, Trimble and the University of Applied Sciences and Arts Northwestern Switzerland FHNW have collaborated to establish a state-of-the-art Trimble Technology Lab at FHNW's School of Architecture, Civil Engineering and Geomatics program in Muttenz, Switzerland.
  • In February 2023, Bentley’s acquisition of EasyPower, to extend integrated and iterative power systems design and analysis for infrastructure digital twins of every type, broadens its comprehensiveness in infrastructure engineering.
  • In Sptember 2022, Autodesk announced a strategic collaboration with Epic Games to accelerate immersive real-time (RT) experiences across industries, with an initial focus on Architecture, Engineering and Construction (AEC).
  • In July 2022, Google has announced a partnership with Genesys International and Tech Mahindra. This new integration of street view into Google Maps offers users to access the up-to-date imagery sourced data from local partners.
  • KEY MARKET SEGMENTS
  • By Offering:
  • Software
  • 3D Mapping Software
  • 3D Projection Mapping
  • GIS Mapping
  • Drone Mapping
  • Satellite and Aerial Imaging
  • Other 3D Mapping Software
  • 3D Modeling Software
  • Solid Modeling
  • Wireframe Modeling
  • Surface Modeling
  • Other 3D Modeling Software
  • Services
  • Professional Services
  • Training & Consulting
  • System Integration & Implementation
  • Support & Maintenance
  • Managed Services
  • By Technology:
  • LiDAR
  • Photogrammetry
  • Structured Light Scanning
  • SLAM
  • Other Technologies
  • Software By Deployment Mode:
  • Cloud
  • On-premises
  • By Vertical:
  • Architecture, Engineering & Construction (AEC)
  • Manufacturing
  • Automotive & Transportation
  • Healthcare & Life Sciences
  • Media & Entertainment
  • Government & Defense
  • Education
  • Agriculture
  • Energy & Utilities
  • Other Verticals
  • By Region:
  • North America
  • US
  • Canada
  • Europe
  • UK
  • Germany
  • France
  • Italy
  • Spain
  • Rest of Europe
  • Asia Pacific
  • China
  • India
  • Japan
  • Australia and New Zealand (ANZ)
  • South Korea
  • ASEAN Countries
  • Rest of Asia Pacific
  • Middle East & Africa
  • UAE
  • Saudi Arabia
  • South Africa
  • Israel
  • Egypt
  • Rest of the Middle East & Africa
  • Latin America
  • Brazil
  • Mexico
  • Argentina
  • Rest of Latin America
  • KEY MARKET PLAYERS
  • Google
  • Autodesk
  • Trimble
  • Bentley Systems
  • Dassault Systemes
  • Adobe
  • Hexagon
  • Esri
  • Golden Software
  • Maxon
  • Topcon
  • CyberCity 3D
  • Pix4D
  • Apple
  • Onionlab
  • Mapbox
  • Saab AB
  • Airbus
  • Intermap Technologies
  • The Foundry Visionmongers
  • PTC
  • MathWorks
  • Ansys
  • Blender Foundation
  • SideFX
  • Civil Maps
  • Hivemapper
  • lvl5
  • Shapr3D
  • Innersight
  • Astrivis Technologies
  • Pointivo
  • Dynamic Map Platform
  • Archilogic
  • MOD Tech Labs
Customization scope Free report customization (15% Free customization) with purchase. Addition or alteration to country, regional & segment scope.
Pricing and purchase options Reap the benefits of customized purchase options to fit your specific research requirements.

Objectives of the Study

  • To forecast the market size, in terms of value, for various segments with respect to five main regions, namely, North America, Europe, Asia-Pacific (APAC), Latin America (LATAM), Middle East & Africa (MEA)
  • To provide detailed information regarding the major factors influencing the growth of the Market (drivers, restraints, opportunities, and challenges)
  • To strategically analyze the micro markets with respect to the individual growth trends, future prospects, and contribution to the total market
  • To provide a detailed overview of the value chain and analyze market trends with the Porter's five forces analysis
  • To analyze the opportunities in the market for various stakeholders by identifying the high-growth Segments
  • To identify the key players and comprehensively analyze their market position in terms of ranking and core competencies, along with detailing the competitive landscape for the market leaders
  • To analyze competitive development such as joint ventures, mergers and acquisitions, new product launches and development, and research and development in the market

What does this Report Deliver?

  • Market Estimation for 20+ Countries
  • Historical data coverage: 2016 to 2022
  • Growth projections: 2022 to 2028
  • SkyQuest's premium market insights: Innovation matrix, IP analysis, Production Analysis, Value chain analysis, Technological trends, and Trade analysis
  • Customization on Segments, Regions, and Company Profiles
  • 100+ tables, 150+ Figures, 10+ matrix
  • Global and Country Market Trends
  • Comprehensive Mapping of Industry Parameters
  • Attractive Investment Proposition
  • Competitive Strategies Adopted by Leading Market Participants
  • Market drivers, restraints, opportunities, and its impact on the market
  • Regulatory scenario, regional dynamics, and insights of leading countries in each region
  • Segment trends analysis, opportunity, and growth
  • Opportunity analysis by region and country
  • Porter's five force analysis to know the market's condition
  • Pricing analysis
  • Parent market analysis
  • Product portfolio benchmarking

Table Of Content

Executive Summary

Market overview

  • Exhibit: Executive Summary – Chart on Market Overview
  • Exhibit: Executive Summary – Data Table on Market Overview
  • Exhibit: Executive Summary – Chart on 3D Mapping and Modeling Market Characteristics
  • Exhibit: Executive Summary – Chart on Market by Geography
  • Exhibit: Executive Summary – Chart on Market Segmentation
  • Exhibit: Executive Summary – Chart on Incremental Growth
  • Exhibit: Executive Summary – Data Table on Incremental Growth
  • Exhibit: Executive Summary – Chart on Vendor Market Positioning

Parent Market Analysis

Market overview

Market size

  • Market Dynamics
    • Exhibit: Impact analysis of DROC, 2021
      • Drivers
      • Opportunities
      • Restraints
      • Challenges
  • SWOT Analysis

KEY MARKET INSIGHTS

  • Technology Analysis
    • (Exhibit: Data Table: Name of technology and details)
  • Pricing Analysis
    • (Exhibit: Data Table: Name of technology and pricing details)
  • Supply Chain Analysis
    • (Exhibit: Detailed Supply Chain Presentation)
  • Value Chain Analysis
    • (Exhibit: Detailed Value Chain Presentation)
  • Ecosystem Of the Market
    • Exhibit: Parent Market Ecosystem Market Analysis
    • Exhibit: Market Characteristics of Parent Market
  • IP Analysis
    • (Exhibit: Data Table: Name of product/technology, patents filed, inventor/company name, acquiring firm)
  • Trade Analysis
    • (Exhibit: Data Table: Import and Export data details)
  • Startup Analysis
    • (Exhibit: Data Table: Emerging startups details)
  • Raw Material Analysis
    • (Exhibit: Data Table: Mapping of key raw materials)
  • Innovation Matrix
    • (Exhibit: Positioning Matrix: Mapping of new and existing technologies)
  • Pipeline product Analysis
    • (Exhibit: Data Table: Name of companies and pipeline products, regional mapping)
  • Macroeconomic Indicators

COVID IMPACT

  • Introduction
  • Impact On Economy—scenario Assessment
    • Exhibit: Data on GDP - Year-over-year growth 2016-2022 (%)
  • Revised Market Size
    • Exhibit: Data Table on 3D Mapping and Modeling Market size and forecast 2021-2027 ($ million)
  • Impact Of COVID On Key Segments
    • Exhibit: Data Table on Segment Market size and forecast 2021-2027 ($ million)
  • COVID Strategies By Company
    • Exhibit: Analysis on key strategies adopted by companies

MARKET DYNAMICS & OUTLOOK

  • Market Dynamics
    • Exhibit: Impact analysis of DROC, 2021
      • Drivers
      • Opportunities
      • Restraints
      • Challenges
  • Regulatory Landscape
    • Exhibit: Data Table on regulation from different region
  • SWOT Analysis
  • Porters Analysis
    • Competitive rivalry
      • Exhibit: Competitive rivalry Impact of key factors, 2021
    • Threat of substitute products
      • Exhibit: Threat of Substitute Products Impact of key factors, 2021
    • Bargaining power of buyers
      • Exhibit: buyers bargaining power Impact of key factors, 2021
    • Threat of new entrants
      • Exhibit: Threat of new entrants Impact of key factors, 2021
    • Bargaining power of suppliers
      • Exhibit: Threat of suppliers bargaining power Impact of key factors, 2021
  • Skyquest special insights on future disruptions
    • Political Impact
    • Economic impact
    • Social Impact
    • Technical Impact
    • Environmental Impact
    • Legal Impact

Market Size by Region

  • Chart on Market share by geography 2021-2027 (%)
  • Data Table on Market share by geography 2021-2027(%)
  • North America
    • Chart on Market share by country 2021-2027 (%)
    • Data Table on Market share by country 2021-2027(%)
    • USA
      • Exhibit: Chart on Market share 2021-2027 (%)
      • Exhibit: Market size and forecast 2021-2027 ($ million)
    • Canada
      • Exhibit: Chart on Market share 2021-2027 (%)
      • Exhibit: Market size and forecast 2021-2027 ($ million)
  • Europe
    • Chart on Market share by country 2021-2027 (%)
    • Data Table on Market share by country 2021-2027(%)
    • Germany
      • Exhibit: Chart on Market share 2021-2027 (%)
      • Exhibit: Market size and forecast 2021-2027 ($ million)
    • Spain
      • Exhibit: Chart on Market share 2021-2027 (%)
      • Exhibit: Market size and forecast 2021-2027 ($ million)
    • France
      • Exhibit: Chart on Market share 2021-2027 (%)
      • Exhibit: Market size and forecast 2021-2027 ($ million)
    • UK
      • Exhibit: Chart on Market share 2021-2027 (%)
      • Exhibit: Market size and forecast 2021-2027 ($ million)
    • Rest of Europe
      • Exhibit: Chart on Market share 2021-2027 (%)
      • Exhibit: Market size and forecast 2021-2027 ($ million)
  • Asia Pacific
    • Chart on Market share by country 2021-2027 (%)
    • Data Table on Market share by country 2021-2027(%)
    • China
      • Exhibit: Chart on Market share 2021-2027 (%)
      • Exhibit: Market size and forecast 2021-2027 ($ million)
    • India
      • Exhibit: Chart on Market share 2021-2027 (%)
      • Exhibit: Market size and forecast 2021-2027 ($ million)
    • Japan
      • Exhibit: Chart on Market share 2021-2027 (%)
      • Exhibit: Market size and forecast 2021-2027 ($ million)
    • South Korea
      • Exhibit: Chart on Market share 2021-2027 (%)
      • Exhibit: Market size and forecast 2021-2027 ($ million)
    • Rest of Asia Pacific
      • Exhibit: Chart on Market share 2021-2027 (%)
      • Exhibit: Market size and forecast 2021-2027 ($ million)
  • Latin America
    • Chart on Market share by country 2021-2027 (%)
    • Data Table on Market share by country 2021-2027(%)
    • Brazil
      • Exhibit: Chart on Market share 2021-2027 (%)
      • Exhibit: Market size and forecast 2021-2027 ($ million)
    • Rest of South America
      • Exhibit: Chart on Market share 2021-2027 (%)
      • Exhibit: Market size and forecast 2021-2027 ($ million)
  • Middle East & Africa (MEA)
    • Chart on Market share by country 2021-2027 (%)
    • Data Table on Market share by country 2021-2027(%)
    • GCC Countries
      • Exhibit: Chart on Market share 2021-2027 (%)
      • Exhibit: Market size and forecast 2021-2027 ($ million)
    • South Africa
      • Exhibit: Chart on Market share 2021-2027 (%)
      • Exhibit: Market size and forecast 2021-2027 ($ million)
    • Rest of MEA
      • Exhibit: Chart on Market share 2021-2027 (%)
      • Exhibit: Market size and forecast 2021-2027 ($ million)

KEY COMPANY PROFILES

  • Competitive Landscape
    • Total number of companies covered
      • Exhibit: companies covered in the report, 2021
    • Top companies market positioning
      • Exhibit: company positioning matrix, 2021
    • Top companies market Share
      • Exhibit: Pie chart analysis on company market share, 2021(%)
  • ing and modeling market is projected to grow from USD 5.4 billion in 2023 to USD 11.8 billion by 2028, at a compound annual growth rate (CAGR) of 17.2% during the forecast period. Due to various business drivers, the 3D mapping and modeling market is expected to grow significantly during the forecast period. The market is experiencing significant growth as the demand for 3D animation across mobile applications and technological advancements in 3D scanners, 3D sensors, and other acquisition devices is growing. The growing availability of 3D content and the advent of 3D-enabled display devices for a better navigation experience is also responsible for driving the market’s growth.
    • Exhibit Company Overview
    • Exhibit Business Segment Overview
    • Exhibit Financial Updates
    • Exhibit Key Developments
  • Market Dynamics
    • Exhibit Company Overview
    • Exhibit Business Segment Overview
    • Exhibit Financial Updates
    • Exhibit Key Developments
  • Driver: Advent of 3D-enabled display devices for a better navigation experience
    • Exhibit Company Overview
    • Exhibit Business Segment Overview
    • Exhibit Financial Updates
    • Exhibit Key Developments
  • Advancements in 3D maps are expected to be driven by the increasing need for an HD experience among users. 3D viewing technology has been available in the market for many years, but the quality delivered to the consumer was inadequate. Consumers always need the best viewing experience of perceived 3D images, similar to what objects look like. Innovative technologies have already started setting foot in the market, which gives users a comfortable HD viewing experience. They provide images of objects that look real and have adequate details. 3D mapping and 3D modeling technologies enable users to have real-life experiences of the surrounding buildings and terrain by viewing them through 3D-enabled devices, such as smartphones, tablets, and Personal Computers (PCs). The demand for 3D-enabled devices is expected to increase in the years to come. According to the statistics, the demand for all 3D-enabled devices is predicted to increase due to technological advancements, changing lifestyles, and the rising awareness among people regarding these advanced devices. Moreover, the increasing need for crisp and realistic image visualization, superior 3D effects, and an excellent mapping and navigation experience are driving the 3D mapping and 3D modeling market.
    • Exhibit Company Overview
    • Exhibit Business Segment Overview
    • Exhibit Financial Updates
    • Exhibit Key Developments
  • Restraints: Increasing corruption and piracy concerns
    • Exhibit Company Overview
    • Exhibit Business Segment Overview
    • Exhibit Financial Updates
    • Exhibit Key Developments
  • The animation industry continues to be exposed to corruption and piracy risks. The software installation of companies is targeted, and pirated copies are sold in the market. Consequently, the industry suffers huge financial losses. To control piracy, companies have developed surveillance and monitoring programs to inhibit the illegal downloading of 3D mapping and modeling software. This, in turn, has encouraged users to use legal digital content. In recent years, government norms and regulatory reforms have been implemented to mitigate piracy threats. However, there is a need to adopt flexible business plans to develop mitigation strategies and undertake proactive measures by forming anti-piracy cells and spreading awareness. For instance, in India, states such as Tamil Nadu and Maharashtra have taken initiatives to spread public awareness against piracy. However, in various countries, the only regulatory policy to prevent piracy is to block sites and impose a penalty on illegal users. According to statistics by DataProt, Software piracy rates worldwide dropped to 37% in 2017, down by 2% from two years earlier.
    • Exhibit Company Overview
    • Exhibit Business Segment Overview
    • Exhibit Financial Updates
    • Exhibit Key Developments
  • Opportunity: Integration with IoT and sensor technologies for real-time data collection and visualization
    • Exhibit Company Overview
    • Exhibit Business Segment Overview
    • Exhibit Financial Updates
    • Exhibit Key Developments
  • The integration of 3D mapping and modeling solutions with Internet of Things (IoT) and sensor technologies enables real-time data collection and visualization, leading to a host of benefits and applications across various industries. IoT devices and sensors gather real-time data from physical objects, equipment, and environments. These devices can capture a wide range of data, including temperature, humidity, pressure, motion, location, etc. By integrating 3D mapping and modeling solutions with IoT devices, businesses can collect vast amounts of data continuously and in real time. 3D mapping and modeling solutions provide a powerful platform for visualizing complex data from IoT devices. Instead of traditional 2D charts and graphs, 3D visualizations enable users to understand data spatially, identifying patterns, trends, and anomalies more effectively. Businesses gain enhanced situational awareness by combining IoT sensor data with 3D mapping and modeling. For example, in smart cities, sensors can monitor traffic flow, air quality, and waste management, and 3D visualizations allow city administrators to make data-driven decisions to optimize city services. Integrating 3D mapping and modeling solutions with IoT and sensor technologies presents a vast array of applications across industries. By leveraging real-time data visualization and analytics, businesses and organizations can make more informed decisions, optimize processes, improve safety, and unlock new levels of efficiency and innovation. As the IoT ecosystem continues to grow, the demand for such integrated solutions is expected to increase significantly.
    • Exhibit Company Overview
    • Exhibit Business Segment Overview
    • Exhibit Financial Updates
    • Exhibit Key Developments
  • Challenge: Stringent government regulations and lack of investments
    • Exhibit Company Overview
    • Exhibit Business Segment Overview
    • Exhibit Financial Updates
    • Exhibit Key Developments
  • The lack of capital investment hinders the growth of the 3D mapping and modeling market. Insufficient fund supply restricts R&D activities, training manpower, and purchasing innovative technologies. Investments in adopting the latest technologies ensure the work system efficiency and increase the number of opportunities for the industry. One major reason for low investor attraction is the slow Return on Investment (ROI) in the animation industry. As a result, private investors are reluctant to enter the 3D mapping and modeling market. Regarding government support, countries like the US, China, Taiwan, Singapore, and Japan provide significant development provisions to boost market growth.
    • Exhibit Company Overview
    • Exhibit Business Segment Overview
    • Exhibit Financial Updates
    • Exhibit Key Developments
  • By offering, solutions segment to account for a larger market size during forecast period
    • Exhibit Company Overview
    • Exhibit Business Segment Overview
    • Exhibit Financial Updates
    • Exhibit Key Developments
  • The 3D mapping and modeling solutions include 3D mapping and modeling software. 3D mapping and modeling solutions comprise a set of technologies, software, and tools that enable the creation, visualization, and manipulation of three-dimensional (3D) representations of real-world objects, landscapes, environments, or virtual entities. These solutions are used in various industries and applications to generate accurate, detailed, and interactive 3D models, which provide valuable insights, support decision-making processes, and enhance user experiences. These solutions offer various visualization methods, such as 3D rendering, animation, and interactive user interfaces, to represent the 3D data and models comprehensibly and informally.
    • Exhibit Company Overview
    • Exhibit Business Segment Overview
    • Exhibit Financial Updates
    • Exhibit Key Developments
  • By technology, photogrammetry registers the highest CAGR during the forecast period
    • Exhibit Company Overview
    • Exhibit Business Segment Overview
    • Exhibit Financial Updates
    • Exhibit Key Developments
  • The photogrammetry segment is projected to grow more during the forecast period. Photogrammetry is a cutting-edge technology making significant strides in 3D mapping and modeling. It involves capturing accurate 3D data from 2D images, enabling the creation of detailed and realistic 3D models of real-world objects and environments. As technology advances, photogrammetry applications have expanded, leading to a growing demand for this innovative solution in various industries.
    • Exhibit Company Overview
    • Exhibit Business Segment Overview
    • Exhibit Financial Updates
    • Exhibit Key Developments
  • By region, North America holds the largest market size during the forecast period
    • Exhibit Company Overview
    • Exhibit Business Segment Overview
    • Exhibit Financial Updates
    • Exhibit Key Developments
  • North America will lead the 3D mapping and modeling market in 2023. North America, comprising the United States and Canada, is known for its advanced technology infrastructure and innovative industries, making it a hub for adopting 3D mapping and modeling technologies. In addition, North America is home to the gaming and entertainment industry, and 3D mapping and modeling solutions play a crucial role in creating visually stunning and realistic gaming environments. The adoption of 3D mapping and modeling solutions in North America is likely to continue growing as these technologies advance and find new applications in various industries. The region's strong technology ecosystem and continuous innovation make it a key player in driving the development and adoption of these solutions globally.
    • Exhibit Company Overview
    • Exhibit Business Segment Overview
    • Exhibit Financial Updates
    • Exhibit Key Developments
  • Recent Developments:
    • Exhibit Company Overview
    • Exhibit Business Segment Overview
    • Exhibit Financial Updates
    • Exhibit Key Developments
  • In June 2023, Dassault Systemes advanced the portfolio transformation of its GEOVIA mining software solutions to integrate them into its 3DEXPERIENCE platform.
    • Exhibit Company Overview
    • Exhibit Business Segment Overview
    • Exhibit Financial Updates
    • Exhibit Key Developments
  • In May 2023, Trimble announced the latest version of Trimble Business Center includes enhancements for CenterPoint RTX corrections, mobile mapping, comparing TBC + TRW for scanning.
    • Exhibit Company Overview
    • Exhibit Business Segment Overview
    • Exhibit Financial Updates
    • Exhibit Key Developments
  • In April 2023, Trimble and the University of Applied Sciences and Arts Northwestern Switzerland FHNW have collaborated to establish a state-of-the-art Trimble Technology Lab at FHNW's School of Architecture, Civil Engineering and Geomatics program in Muttenz, Switzerland.
    • Exhibit Company Overview
    • Exhibit Business Segment Overview
    • Exhibit Financial Updates
    • Exhibit Key Developments
  • In February 2023, Bentley’s acquisition of EasyPower, to extend integrated and iterative power systems design and analysis for infrastructure digital twins of every type, broadens its comprehensiveness in infrastructure engineering.
    • Exhibit Company Overview
    • Exhibit Business Segment Overview
    • Exhibit Financial Updates
    • Exhibit Key Developments
  • In Sptember 2022, Autodesk announced a strategic collaboration with Epic Games to accelerate immersive real-time (RT) experiences across industries, with an initial focus on Architecture, Engineering and Construction (AEC).
    • Exhibit Company Overview
    • Exhibit Business Segment Overview
    • Exhibit Financial Updates
    • Exhibit Key Developments
  • In July 2022, Google has announced a partnership with Genesys International and Tech Mahindra. This new integration of street view into Google Maps offers users to access the up-to-date imagery sourced data from local partners.
    • Exhibit Company Overview
    • Exhibit Business Segment Overview
    • Exhibit Financial Updates
    • Exhibit Key Developments
  • KEY MARKET SEGMENTS
    • Exhibit Company Overview
    • Exhibit Business Segment Overview
    • Exhibit Financial Updates
    • Exhibit Key Developments
  • By Offering:
    • Exhibit Company Overview
    • Exhibit Business Segment Overview
    • Exhibit Financial Updates
    • Exhibit Key Developments
  • Software
    • Exhibit Company Overview
    • Exhibit Business Segment Overview
    • Exhibit Financial Updates
    • Exhibit Key Developments
  • 3D Mapping Software
    • Exhibit Company Overview
    • Exhibit Business Segment Overview
    • Exhibit Financial Updates
    • Exhibit Key Developments
  • 3D Projection Mapping
    • Exhibit Company Overview
    • Exhibit Business Segment Overview
    • Exhibit Financial Updates
    • Exhibit Key Developments
  • GIS Mapping
    • Exhibit Company Overview
    • Exhibit Business Segment Overview
    • Exhibit Financial Updates
    • Exhibit Key Developments
  • Drone Mapping
    • Exhibit Company Overview
    • Exhibit Business Segment Overview
    • Exhibit Financial Updates
    • Exhibit Key Developments
  • Satellite and Aerial Imaging
    • Exhibit Company Overview
    • Exhibit Business Segment Overview
    • Exhibit Financial Updates
    • Exhibit Key Developments
  • Other 3D Mapping Software
    • Exhibit Company Overview
    • Exhibit Business Segment Overview
    • Exhibit Financial Updates
    • Exhibit Key Developments
  • 3D Modeling Software
    • Exhibit Company Overview
    • Exhibit Business Segment Overview
    • Exhibit Financial Updates
    • Exhibit Key Developments
  • Solid Modeling
    • Exhibit Company Overview
    • Exhibit Business Segment Overview
    • Exhibit Financial Updates
    • Exhibit Key Developments
  • Wireframe Modeling
    • Exhibit Company Overview
    • Exhibit Business Segment Overview
    • Exhibit Financial Updates
    • Exhibit Key Developments
  • Surface Modeling
    • Exhibit Company Overview
    • Exhibit Business Segment Overview
    • Exhibit Financial Updates
    • Exhibit Key Developments
  • Other 3D Modeling Software
    • Exhibit Company Overview
    • Exhibit Business Segment Overview
    • Exhibit Financial Updates
    • Exhibit Key Developments
  • Services
    • Exhibit Company Overview
    • Exhibit Business Segment Overview
    • Exhibit Financial Updates
    • Exhibit Key Developments
  • Professional Services
    • Exhibit Company Overview
    • Exhibit Business Segment Overview
    • Exhibit Financial Updates
    • Exhibit Key Developments
  • Training & Consulting
    • Exhibit Company Overview
    • Exhibit Business Segment Overview
    • Exhibit Financial Updates
    • Exhibit Key Developments
  • System Integration & Implementation
    • Exhibit Company Overview
    • Exhibit Business Segment Overview
    • Exhibit Financial Updates
    • Exhibit Key Developments
  • Support & Maintenance
    • Exhibit Company Overview
    • Exhibit Business Segment Overview
    • Exhibit Financial Updates
    • Exhibit Key Developments
  • Managed Services
    • Exhibit Company Overview
    • Exhibit Business Segment Overview
    • Exhibit Financial Updates
    • Exhibit Key Developments
  • By Technology:
    • Exhibit Company Overview
    • Exhibit Business Segment Overview
    • Exhibit Financial Updates
    • Exhibit Key Developments
  • LiDAR
    • Exhibit Company Overview
    • Exhibit Business Segment Overview
    • Exhibit Financial Updates
    • Exhibit Key Developments
  • Photogrammetry
    • Exhibit Company Overview
    • Exhibit Business Segment Overview
    • Exhibit Financial Updates
    • Exhibit Key Developments
  • Structured Light Scanning
    • Exhibit Company Overview
    • Exhibit Business Segment Overview
    • Exhibit Financial Updates
    • Exhibit Key Developments
  • SLAM
    • Exhibit Company Overview
    • Exhibit Business Segment Overview
    • Exhibit Financial Updates
    • Exhibit Key Developments
  • Other Technologies
    • Exhibit Company Overview
    • Exhibit Business Segment Overview
    • Exhibit Financial Updates
    • Exhibit Key Developments
  • Software By Deployment Mode:
    • Exhibit Company Overview
    • Exhibit Business Segment Overview
    • Exhibit Financial Updates
    • Exhibit Key Developments
  • Cloud
    • Exhibit Company Overview
    • Exhibit Business Segment Overview
    • Exhibit Financial Updates
    • Exhibit Key Developments
  • On-premises
    • Exhibit Company Overview
    • Exhibit Business Segment Overview
    • Exhibit Financial Updates
    • Exhibit Key Developments
  • By Vertical:
    • Exhibit Company Overview
    • Exhibit Business Segment Overview
    • Exhibit Financial Updates
    • Exhibit Key Developments
  • Architecture, Engineering & Construction (AEC)
    • Exhibit Company Overview
    • Exhibit Business Segment Overview
    • Exhibit Financial Updates
    • Exhibit Key Developments
  • Manufacturing
    • Exhibit Company Overview
    • Exhibit Business Segment Overview
    • Exhibit Financial Updates
    • Exhibit Key Developments
  • Automotive & Transportation
    • Exhibit Company Overview
    • Exhibit Business Segment Overview
    • Exhibit Financial Updates
    • Exhibit Key Developments
  • Healthcare & Life Sciences
    • Exhibit Company Overview
    • Exhibit Business Segment Overview
    • Exhibit Financial Updates
    • Exhibit Key Developments
  • Media & Entertainment
    • Exhibit Company Overview
    • Exhibit Business Segment Overview
    • Exhibit Financial Updates
    • Exhibit Key Developments
  • Government & Defense
    • Exhibit Company Overview
    • Exhibit Business Segment Overview
    • Exhibit Financial Updates
    • Exhibit Key Developments
  • Education
    • Exhibit Company Overview
    • Exhibit Business Segment Overview
    • Exhibit Financial Updates
    • Exhibit Key Developments
  • Agriculture
    • Exhibit Company Overview
    • Exhibit Business Segment Overview
    • Exhibit Financial Updates
    • Exhibit Key Developments
  • Energy & Utilities
    • Exhibit Company Overview
    • Exhibit Business Segment Overview
    • Exhibit Financial Updates
    • Exhibit Key Developments
  • Other Verticals
    • Exhibit Company Overview
    • Exhibit Business Segment Overview
    • Exhibit Financial Updates
    • Exhibit Key Developments
  • By Region:
    • Exhibit Company Overview
    • Exhibit Business Segment Overview
    • Exhibit Financial Updates
    • Exhibit Key Developments
  • North America
    • Exhibit Company Overview
    • Exhibit Business Segment Overview
    • Exhibit Financial Updates
    • Exhibit Key Developments
  • US
    • Exhibit Company Overview
    • Exhibit Business Segment Overview
    • Exhibit Financial Updates
    • Exhibit Key Developments
  • Canada
    • Exhibit Company Overview
    • Exhibit Business Segment Overview
    • Exhibit Financial Updates
    • Exhibit Key Developments
  • Europe
    • Exhibit Company Overview
    • Exhibit Business Segment Overview
    • Exhibit Financial Updates
    • Exhibit Key Developments
  • UK
    • Exhibit Company Overview
    • Exhibit Business Segment Overview
    • Exhibit Financial Updates
    • Exhibit Key Developments
  • Germany
    • Exhibit Company Overview
    • Exhibit Business Segment Overview
    • Exhibit Financial Updates
    • Exhibit Key Developments
  • France
    • Exhibit Company Overview
    • Exhibit Business Segment Overview
    • Exhibit Financial Updates
    • Exhibit Key Developments
  • Italy
    • Exhibit Company Overview
    • Exhibit Business Segment Overview
    • Exhibit Financial Updates
    • Exhibit Key Developments
  • Spain
    • Exhibit Company Overview
    • Exhibit Business Segment Overview
    • Exhibit Financial Updates
    • Exhibit Key Developments
  • Rest of Europe
    • Exhibit Company Overview
    • Exhibit Business Segment Overview
    • Exhibit Financial Updates
    • Exhibit Key Developments
  • Asia Pacific
    • Exhibit Company Overview
    • Exhibit Business Segment Overview
    • Exhibit Financial Updates
    • Exhibit Key Developments
  • China
    • Exhibit Company Overview
    • Exhibit Business Segment Overview
    • Exhibit Financial Updates
    • Exhibit Key Developments
  • India
    • Exhibit Company Overview
    • Exhibit Business Segment Overview
    • Exhibit Financial Updates
    • Exhibit Key Developments
  • Japan
    • Exhibit Company Overview
    • Exhibit Business Segment Overview
    • Exhibit Financial Updates
    • Exhibit Key Developments
  • Australia and New Zealand (ANZ)
    • Exhibit Company Overview
    • Exhibit Business Segment Overview
    • Exhibit Financial Updates
    • Exhibit Key Developments
  • South Korea
    • Exhibit Company Overview
    • Exhibit Business Segment Overview
    • Exhibit Financial Updates
    • Exhibit Key Developments
  • ASEAN Countries
    • Exhibit Company Overview
    • Exhibit Business Segment Overview
    • Exhibit Financial Updates
    • Exhibit Key Developments
  • Rest of Asia Pacific
    • Exhibit Company Overview
    • Exhibit Business Segment Overview
    • Exhibit Financial Updates
    • Exhibit Key Developments
  • Middle East & Africa
    • Exhibit Company Overview
    • Exhibit Business Segment Overview
    • Exhibit Financial Updates
    • Exhibit Key Developments
  • UAE
    • Exhibit Company Overview
    • Exhibit Business Segment Overview
    • Exhibit Financial Updates
    • Exhibit Key Developments
  • Saudi Arabia
    • Exhibit Company Overview
    • Exhibit Business Segment Overview
    • Exhibit Financial Updates
    • Exhibit Key Developments
  • South Africa
    • Exhibit Company Overview
    • Exhibit Business Segment Overview
    • Exhibit Financial Updates
    • Exhibit Key Developments
  • Israel
    • Exhibit Company Overview
    • Exhibit Business Segment Overview
    • Exhibit Financial Updates
    • Exhibit Key Developments
  • Egypt
    • Exhibit Company Overview
    • Exhibit Business Segment Overview
    • Exhibit Financial Updates
    • Exhibit Key Developments
  • Rest of the Middle East & Africa
    • Exhibit Company Overview
    • Exhibit Business Segment Overview
    • Exhibit Financial Updates
    • Exhibit Key Developments
  • Latin America
    • Exhibit Company Overview
    • Exhibit Business Segment Overview
    • Exhibit Financial Updates
    • Exhibit Key Developments
  • Brazil
    • Exhibit Company Overview
    • Exhibit Business Segment Overview
    • Exhibit Financial Updates
    • Exhibit Key Developments
  • Mexico
    • Exhibit Company Overview
    • Exhibit Business Segment Overview
    • Exhibit Financial Updates
    • Exhibit Key Developments
  • Argentina
    • Exhibit Company Overview
    • Exhibit Business Segment Overview
    • Exhibit Financial Updates
    • Exhibit Key Developments
  • Rest of Latin America
    • Exhibit Company Overview
    • Exhibit Business Segment Overview
    • Exhibit Financial Updates
    • Exhibit Key Developments
  • KEY MARKET PLAYERS
    • Exhibit Company Overview
    • Exhibit Business Segment Overview
    • Exhibit Financial Updates
    • Exhibit Key Developments
  • Google
    • Exhibit Company Overview
    • Exhibit Business Segment Overview
    • Exhibit Financial Updates
    • Exhibit Key Developments
  • Autodesk
    • Exhibit Company Overview
    • Exhibit Business Segment Overview
    • Exhibit Financial Updates
    • Exhibit Key Developments
  • Trimble
    • Exhibit Company Overview
    • Exhibit Business Segment Overview
    • Exhibit Financial Updates
    • Exhibit Key Developments
  • Bentley Systems
    • Exhibit Company Overview
    • Exhibit Business Segment Overview
    • Exhibit Financial Updates
    • Exhibit Key Developments
  • Dassault Systemes
    • Exhibit Company Overview
    • Exhibit Business Segment Overview
    • Exhibit Financial Updates
    • Exhibit Key Developments
  • Adobe
    • Exhibit Company Overview
    • Exhibit Business Segment Overview
    • Exhibit Financial Updates
    • Exhibit Key Developments
  • Hexagon
    • Exhibit Company Overview
    • Exhibit Business Segment Overview
    • Exhibit Financial Updates
    • Exhibit Key Developments
  • Esri
    • Exhibit Company Overview
    • Exhibit Business Segment Overview
    • Exhibit Financial Updates
    • Exhibit Key Developments
  • Golden Software
    • Exhibit Company Overview
    • Exhibit Business Segment Overview
    • Exhibit Financial Updates
    • Exhibit Key Developments
  • Maxon
    • Exhibit Company Overview
    • Exhibit Business Segment Overview
    • Exhibit Financial Updates
    • Exhibit Key Developments
  • Topcon
    • Exhibit Company Overview
    • Exhibit Business Segment Overview
    • Exhibit Financial Updates
    • Exhibit Key Developments
  • CyberCity 3D
    • Exhibit Company Overview
    • Exhibit Business Segment Overview
    • Exhibit Financial Updates
    • Exhibit Key Developments
  • Pix4D
    • Exhibit Company Overview
    • Exhibit Business Segment Overview
    • Exhibit Financial Updates
    • Exhibit Key Developments
  • Apple
    • Exhibit Company Overview
    • Exhibit Business Segment Overview
    • Exhibit Financial Updates
    • Exhibit Key Developments
  • Onionlab
    • Exhibit Company Overview
    • Exhibit Business Segment Overview
    • Exhibit Financial Updates
    • Exhibit Key Developments
  • Mapbox
    • Exhibit Company Overview
    • Exhibit Business Segment Overview
    • Exhibit Financial Updates
    • Exhibit Key Developments
  • Saab AB
    • Exhibit Company Overview
    • Exhibit Business Segment Overview
    • Exhibit Financial Updates
    • Exhibit Key Developments
  • Airbus
    • Exhibit Company Overview
    • Exhibit Business Segment Overview
    • Exhibit Financial Updates
    • Exhibit Key Developments
  • Intermap Technologies
    • Exhibit Company Overview
    • Exhibit Business Segment Overview
    • Exhibit Financial Updates
    • Exhibit Key Developments
  • The Foundry Visionmongers
    • Exhibit Company Overview
    • Exhibit Business Segment Overview
    • Exhibit Financial Updates
    • Exhibit Key Developments
  • PTC
    • Exhibit Company Overview
    • Exhibit Business Segment Overview
    • Exhibit Financial Updates
    • Exhibit Key Developments
  • MathWorks
    • Exhibit Company Overview
    • Exhibit Business Segment Overview
    • Exhibit Financial Updates
    • Exhibit Key Developments
  • Ansys
    • Exhibit Company Overview
    • Exhibit Business Segment Overview
    • Exhibit Financial Updates
    • Exhibit Key Developments
  • Blender Foundation
    • Exhibit Company Overview
    • Exhibit Business Segment Overview
    • Exhibit Financial Updates
    • Exhibit Key Developments
  • SideFX
    • Exhibit Company Overview
    • Exhibit Business Segment Overview
    • Exhibit Financial Updates
    • Exhibit Key Developments
  • Civil Maps
    • Exhibit Company Overview
    • Exhibit Business Segment Overview
    • Exhibit Financial Updates
    • Exhibit Key Developments
  • Hivemapper
    • Exhibit Company Overview
    • Exhibit Business Segment Overview
    • Exhibit Financial Updates
    • Exhibit Key Developments
  • lvl5
    • Exhibit Company Overview
    • Exhibit Business Segment Overview
    • Exhibit Financial Updates
    • Exhibit Key Developments
  • Shapr3D
    • Exhibit Company Overview
    • Exhibit Business Segment Overview
    • Exhibit Financial Updates
    • Exhibit Key Developments
  • Innersight
    • Exhibit Company Overview
    • Exhibit Business Segment Overview
    • Exhibit Financial Updates
    • Exhibit Key Developments
  • Astrivis Technologies
    • Exhibit Company Overview
    • Exhibit Business Segment Overview
    • Exhibit Financial Updates
    • Exhibit Key Developments
  • Pointivo
    • Exhibit Company Overview
    • Exhibit Business Segment Overview
    • Exhibit Financial Updates
    • Exhibit Key Developments
  • Dynamic Map Platform
    • Exhibit Company Overview
    • Exhibit Business Segment Overview
    • Exhibit Financial Updates
    • Exhibit Key Developments
  • Archilogic
    • Exhibit Company Overview
    • Exhibit Business Segment Overview
    • Exhibit Financial Updates
    • Exhibit Key Developments
  • MOD Tech Labs
    • Exhibit Company Overview
    • Exhibit Business Segment Overview
    • Exhibit Financial Updates
    • Exhibit Key Developments

Methodology

For the 3D Mapping and Modeling Market, our research methodology involved a mixture of primary and secondary data sources. Key steps involved in the research process are listed below:

1. Information Procurement: This stage involved the procurement of Market data or related information via primary and secondary sources. The various secondary sources used included various company websites, annual reports, trade databases, and paid databases such as Hoover's, Bloomberg Business, Factiva, and Avention. Our team did 45 primary interactions Globally which included several stakeholders such as manufacturers, customers, key opinion leaders, etc. Overall, information procurement was one of the most extensive stages in our research process.

2. Information Analysis: This step involved triangulation of data through bottom-up and top-down approaches to estimate and validate the total size and future estimate of the 3D Mapping and Modeling Market.

3. Report Formulation: The final step entailed the placement of data points in appropriate Market spaces in an attempt to deduce viable conclusions.

4. Validation & Publishing: Validation is the most important step in the process. Validation & re-validation via an intricately designed process helped us finalize data points to be used for final calculations. The final Market estimates and forecasts were then aligned and sent to our panel of industry experts for validation of data. Once the validation was done the report was sent to our Quality Assurance team to ensure adherence to style guides, consistency & design.

Analyst Support

Customization Options

With the given market data, our dedicated team of analysts can offer you the following customization options are available for the 3D Mapping and Modeling Market:

Product Analysis: Product matrix, which offers a detailed comparison of the product portfolio of companies.

Regional Analysis: Further analysis of the 3D Mapping and Modeling Market for additional countries.

Competitive Analysis: Detailed analysis and profiling of additional Market players & comparative analysis of competitive products.

Go to Market Strategy: Find the high-growth channels to invest your marketing efforts and increase your customer base.

Innovation Mapping: Identify racial solutions and innovation, connected to deep ecosystems of innovators, start-ups, academics, and strategic partners.

Category Intelligence: Customized intelligence that is relevant to their supply Markets will enable them to make smarter sourcing decisions and improve their category management.

Public Company Transcript Analysis: To improve the investment performance by generating new alpha and making better-informed decisions.

Social Media Listening: To analyze the conversations and trends happening not just around your brand, but around your industry as a whole, and use those insights to make better Marketing decisions.

$5,300
BUY NOW

REQUEST FOR SAMPLE

Want to customize this report?
REQUEST FREE CUSTOMIZATION

FAQs

The market for 3D Mapping and Modeling was estimated to be valued at US$ XX Mn in 2021.

The 3D Mapping and Modeling Market is estimated to grow at a CAGR of XX% by 2028.

The 3D Mapping and Modeling Market is segmented on the basis of Offering:, Technology:, Software Deployment Mode:, Vertical:, Region:.

Based on region, the 3D Mapping and Modeling Market is segmented into North America, Europe, Asia Pacific, Middle East & Africa and Latin America.

The key players operating in the 3D Mapping and Modeling Market are ing and modeling market is projected to grow from USD 5.4 billion in 2023 to USD 11.8 billion by 2028, at a compound annual growth rate (CAGR) of 17.2% during the forecast period. Due to various business drivers, the 3D mapping and modeling market is expected to grow significantly during the forecast period. The market is experiencing significant growth as the demand for 3D animation across mobile applications and technological advancements in 3D scanners, 3D sensors, and other acquisition devices is growing. The growing availability of 3D content and the advent of 3D-enabled display devices for a better navigation experience is also responsible for driving the market’s growth. , Market Dynamics , Driver: Advent of 3D-enabled display devices for a better navigation experience , Advancements in 3D maps are expected to be driven by the increasing need for an HD experience among users. 3D viewing technology has been available in the market for many years, but the quality delivered to the consumer was inadequate. Consumers always need the best viewing experience of perceived 3D images, similar to what objects look like. Innovative technologies have already started setting foot in the market, which gives users a comfortable HD viewing experience. They provide images of objects that look real and have adequate details. 3D mapping and 3D modeling technologies enable users to have real-life experiences of the surrounding buildings and terrain by viewing them through 3D-enabled devices, such as smartphones, tablets, and Personal Computers (PCs). The demand for 3D-enabled devices is expected to increase in the years to come. According to the statistics, the demand for all 3D-enabled devices is predicted to increase due to technological advancements, changing lifestyles, and the rising awareness among people regarding these advanced devices. Moreover, the increasing need for crisp and realistic image visualization, superior 3D effects, and an excellent mapping and navigation experience are driving the 3D mapping and 3D modeling market. , Restraints: Increasing corruption and piracy concerns , The animation industry continues to be exposed to corruption and piracy risks. The software installation of companies is targeted, and pirated copies are sold in the market. Consequently, the industry suffers huge financial losses. To control piracy, companies have developed surveillance and monitoring programs to inhibit the illegal downloading of 3D mapping and modeling software. This, in turn, has encouraged users to use legal digital content. In recent years, government norms and regulatory reforms have been implemented to mitigate piracy threats. However, there is a need to adopt flexible business plans to develop mitigation strategies and undertake proactive measures by forming anti-piracy cells and spreading awareness. For instance, in India, states such as Tamil Nadu and Maharashtra have taken initiatives to spread public awareness against piracy. However, in various countries, the only regulatory policy to prevent piracy is to block sites and impose a penalty on illegal users. According to statistics by DataProt, Software piracy rates worldwide dropped to 37% in 2017, down by 2% from two years earlier. , Opportunity: Integration with IoT and sensor technologies for real-time data collection and visualization , The integration of 3D mapping and modeling solutions with Internet of Things (IoT) and sensor technologies enables real-time data collection and visualization, leading to a host of benefits and applications across various industries. IoT devices and sensors gather real-time data from physical objects, equipment, and environments. These devices can capture a wide range of data, including temperature, humidity, pressure, motion, location, etc. By integrating 3D mapping and modeling solutions with IoT devices, businesses can collect vast amounts of data continuously and in real time. 3D mapping and modeling solutions provide a powerful platform for visualizing complex data from IoT devices. Instead of traditional 2D charts and graphs, 3D visualizations enable users to understand data spatially, identifying patterns, trends, and anomalies more effectively. Businesses gain enhanced situational awareness by combining IoT sensor data with 3D mapping and modeling. For example, in smart cities, sensors can monitor traffic flow, air quality, and waste management, and 3D visualizations allow city administrators to make data-driven decisions to optimize city services. Integrating 3D mapping and modeling solutions with IoT and sensor technologies presents a vast array of applications across industries. By leveraging real-time data visualization and analytics, businesses and organizations can make more informed decisions, optimize processes, improve safety, and unlock new levels of efficiency and innovation. As the IoT ecosystem continues to grow, the demand for such integrated solutions is expected to increase significantly. , Challenge: Stringent government regulations and lack of investments , The lack of capital investment hinders the growth of the 3D mapping and modeling market. Insufficient fund supply restricts R&D activities, training manpower, and purchasing innovative technologies. Investments in adopting the latest technologies ensure the work system efficiency and increase the number of opportunities for the industry. One major reason for low investor attraction is the slow Return on Investment (ROI) in the animation industry. As a result, private investors are reluctant to enter the 3D mapping and modeling market. Regarding government support, countries like the US, China, Taiwan, Singapore, and Japan provide significant development provisions to boost market growth. , By offering, solutions segment to account for a larger market size during forecast period , The 3D mapping and modeling solutions include 3D mapping and modeling software. 3D mapping and modeling solutions comprise a set of technologies, software, and tools that enable the creation, visualization, and manipulation of three-dimensional (3D) representations of real-world objects, landscapes, environments, or virtual entities. These solutions are used in various industries and applications to generate accurate, detailed, and interactive 3D models, which provide valuable insights, support decision-making processes, and enhance user experiences. These solutions offer various visualization methods, such as 3D rendering, animation, and interactive user interfaces, to represent the 3D data and models comprehensibly and informally. , By technology, photogrammetry registers the highest CAGR during the forecast period , The photogrammetry segment is projected to grow more during the forecast period. Photogrammetry is a cutting-edge technology making significant strides in 3D mapping and modeling. It involves capturing accurate 3D data from 2D images, enabling the creation of detailed and realistic 3D models of real-world objects and environments. As technology advances, photogrammetry applications have expanded, leading to a growing demand for this innovative solution in various industries. , By region, North America holds the largest market size during the forecast period , North America will lead the 3D mapping and modeling market in 2023. North America, comprising the United States and Canada, is known for its advanced technology infrastructure and innovative industries, making it a hub for adopting 3D mapping and modeling technologies. In addition, North America is home to the gaming and entertainment industry, and 3D mapping and modeling solutions play a crucial role in creating visually stunning and realistic gaming environments. The adoption of 3D mapping and modeling solutions in North America is likely to continue growing as these technologies advance and find new applications in various industries. The region's strong technology ecosystem and continuous innovation make it a key player in driving the development and adoption of these solutions globally. , Recent Developments: , In June 2023, Dassault Systemes advanced the portfolio transformation of its GEOVIA mining software solutions to integrate them into its 3DEXPERIENCE platform. , In May 2023, Trimble announced the latest version of Trimble Business Center includes enhancements for CenterPoint RTX corrections, mobile mapping, comparing TBC + TRW for scanning. , In April 2023, Trimble and the University of Applied Sciences and Arts Northwestern Switzerland FHNW have collaborated to establish a state-of-the-art Trimble Technology Lab at FHNW's School of Architecture, Civil Engineering and Geomatics program in Muttenz, Switzerland. , In February 2023, Bentley’s acquisition of EasyPower, to extend integrated and iterative power systems design and analysis for infrastructure digital twins of every type, broadens its comprehensiveness in infrastructure engineering. , In Sptember 2022, Autodesk announced a strategic collaboration with Epic Games to accelerate immersive real-time (RT) experiences across industries, with an initial focus on Architecture, Engineering and Construction (AEC). , In July 2022, Google has announced a partnership with Genesys International and Tech Mahindra. This new integration of street view into Google Maps offers users to access the up-to-date imagery sourced data from local partners. , KEY MARKET SEGMENTS , By Offering: , Software , 3D Mapping Software , 3D Projection Mapping , GIS Mapping , Drone Mapping , Satellite and Aerial Imaging , Other 3D Mapping Software , 3D Modeling Software , Solid Modeling , Wireframe Modeling , Surface Modeling , Other 3D Modeling Software , Services , Professional Services , Training & Consulting , System Integration & Implementation , Support & Maintenance , Managed Services , By Technology: , LiDAR , Photogrammetry , Structured Light Scanning , SLAM , Other Technologies , Software By Deployment Mode: , Cloud , On-premises , By Vertical: , Architecture, Engineering & Construction (AEC) , Manufacturing , Automotive & Transportation , Healthcare & Life Sciences , Media & Entertainment , Government & Defense , Education , Agriculture , Energy & Utilities , Other Verticals , By Region: , North America , US , Canada , Europe , UK , Germany , France , Italy , Spain , Rest of Europe , Asia Pacific , China , India , Japan , Australia and New Zealand (ANZ) , South Korea , ASEAN Countries , Rest of Asia Pacific , Middle East & Africa , UAE , Saudi Arabia , South Africa , Israel , Egypt , Rest of the Middle East & Africa , Latin America , Brazil , Mexico , Argentina , Rest of Latin America , KEY MARKET PLAYERS , Google , Autodesk , Trimble , Bentley Systems , Dassault Systemes , Adobe , Hexagon , Esri , Golden Software , Maxon , Topcon , CyberCity 3D , Pix4D , Apple , Onionlab , Mapbox , Saab AB , Airbus , Intermap Technologies , The Foundry Visionmongers , PTC , MathWorks , Ansys , Blender Foundation , SideFX , Civil Maps , Hivemapper , lvl5 , Shapr3D , Innersight , Astrivis Technologies , Pointivo , Dynamic Map Platform , Archilogic , MOD Tech Labs.

Request Free Customization

Want to customize this report? This report can be personalized according to your needs. Our analysts and industry experts will work directly with you to understand your requirements and provide you with customized data in a short amount of time. We offer $1000 worth of FREE customization at the time of purchase.

logo-images

Feedback From Our Clients

3D Mapping and Modeling Market

Report ID: UCMIG45E2223

sales@skyquestt.com
USA +1 351-333-4748

BUY NOW GET FREE SAMPLE