Over-the-Top/OTT Market Size, Share, Growth Analysis, By Device Type(Smartphones & Tablets, Desktops & Laptops, and IPTV & Consoles), By Content Type(Video, Audio/VoIP, Games, and Communication), By Revenue Model(Subscription, Advertisement, Transaction), By End-User(Media & Entertainment, Education & Learning, Autonomous driving, Gaming), By Region - Industry Forecast 2024-2031


Report ID: SQMIG50I2003 | Region: Global | Published Date: July, 2001
Pages: 260 |Tables: 120 |Figures: 78

Over-the-Top/OTT Market Insights

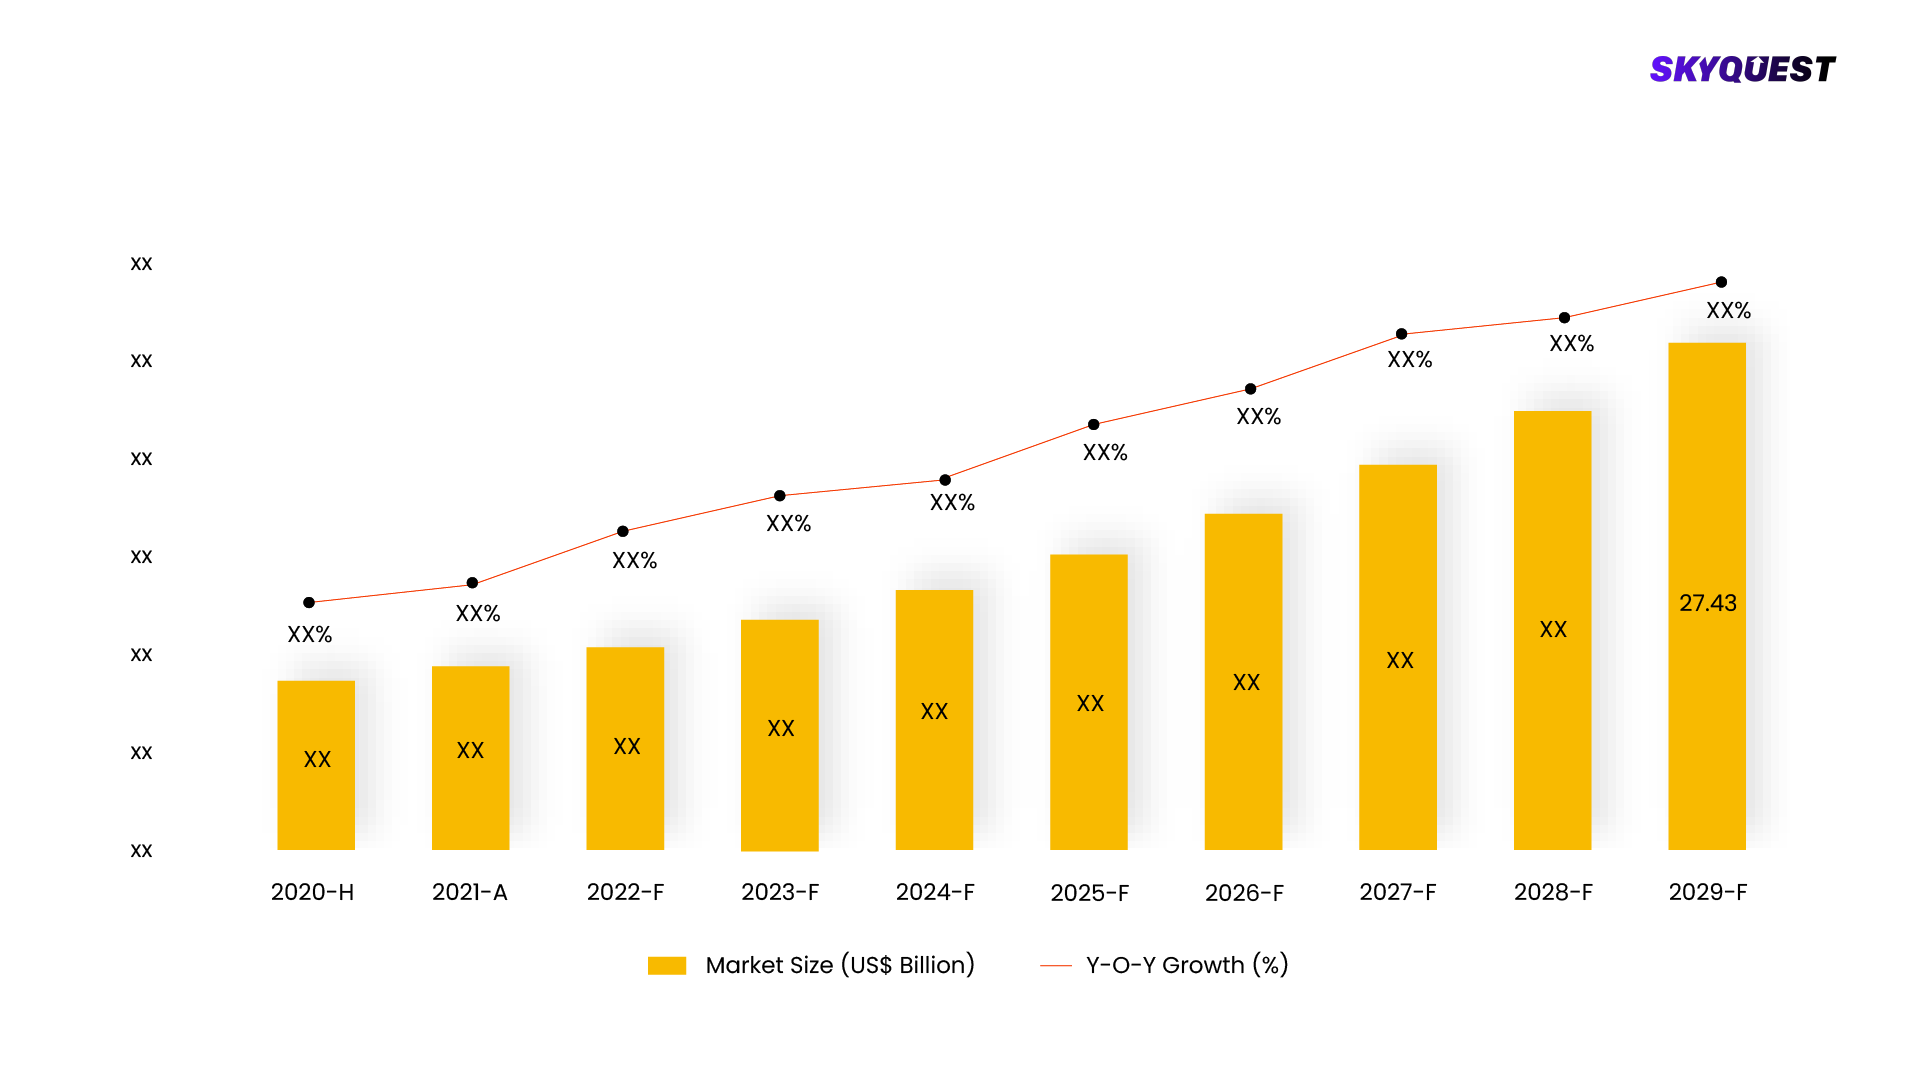
Over-the-Top/OTT Market size was valued at USD 150.51 billion in 2019 and is poised to grow from USD 190.32 billion in 2023 to USD 1241.6 billion by 2031, growing at a CAGR of 26.42% in the forecast period (2024-2031).

Over-the-Top/OTT (OTT) is a platform that allows access to film and television content by using a high-speed internet connection instead of cable or satellite that is provider-based. OTT acceptance has considerably assisted the video, podcast, and audio streaming offerings. The narrow type selections, packaging options, wider device availability, internet penetration, and overall cheaper costs are all contributing to increased acceptance. Furthermore, the rising demand for personalized data has resulted in a huge increase in the use of OTT devices.

OTT has gained enormous popularity due to effective social media marketing that has sold OTTs as a “healthier” alcohol choice. OTT's growth is also due to numerous manufacturers entering the market and offering a large variety of products and multiple product launches.

US Over-the-Top/OTT Market is poised to grow at a sustainable CAGR for the next forecast year.

Market Snapshot - 2024-2031

Global Market Size

USD 150.51 billion

Largest Segment

Media & Entertainment

Fastest Growth

Media & Entertainment

Growth Rate

26.42% CAGR

Global Over-the-top/ OTT Market, 2021-2028 ($ Bn)
Country Share for North America Region- 2021 (%)

To get more reports on the above market click here to Buy The Report

Over-the-Top/OTT Market Segmental Analysis

The Global Over-the-Top/OTT market is segmented based on Device Type, Content Type, Revenue Model, End-User and region. By Device Type, the Over-the-Top/OTT Market is segmented into Smartphones & Tablets, Desktops & Laptops, and IPTV & Consoles. By Content Type, the Over-the-Top/OTT Market is segmented into Video, Audio/VoIP, Games,  and Communication. By Revenue Model, the market is segmented into Subscription, Advertisement, and Transaction. By End-User, the Over-the-Top/OTT Market is segmented into Media & Entertainment, Education & Learning, Autonomous driving, Gaming, and Service Utilities. Based on region Over-the-Top/OTT Market  is categorized into: North America, Europe, Asia-Pacific, South America, and MEA.

Over-the-Top/OTT Market Analysis by End User

Due to an increase in the number of digital video viewers, the media and entertainment industry dominated the Over-the-Top/OTT market share in 2021 and is likely to continue dominating during the forecast period. This is expected to boost demand for OTT services in the media and entertainment industries. The IT & telecom business, on the other hand, is predicted to grow at the fastest rate throughout the projection period, owing to an increase in demand for Over-the-Top/OTT services in the telecommunications industry for video calling, voice, and messaging services.

Over-the-Top/OTT Market Analysis by Revenue Model

In the Over-the-Top/OTT Services Market, the online gaming market will be more transactional than subscription-based. Users want to experience content ownership when it comes to online gaming, so the transaction-based monetization model will increase rapidly. They wish to purchase the complete content so that it can be used with freedom and comfort at any time.

Global Over-the-top/ OTT Market By End User , 2021(%)

To get detailed analysis on other segments, Request For Free Sample Report

Over-the-Top/OTT Market Regional Insights

North America accounted for a noteworthy share of the market. In the US, 64 million homes are using OTT, with an average once-a-month viewing value of more than 80 hours of OTT data. Furthermore, OTT content types mostly related to education, games, and entertainment are seeing increased developments, with more than 60% reach among homes with Wi-Fi. The use of Over-the-Top/OTT (OTT) in sports is getting more widespread. Rising content gaining expenditure throughout this area proves how many companies are incoming the OTT field.

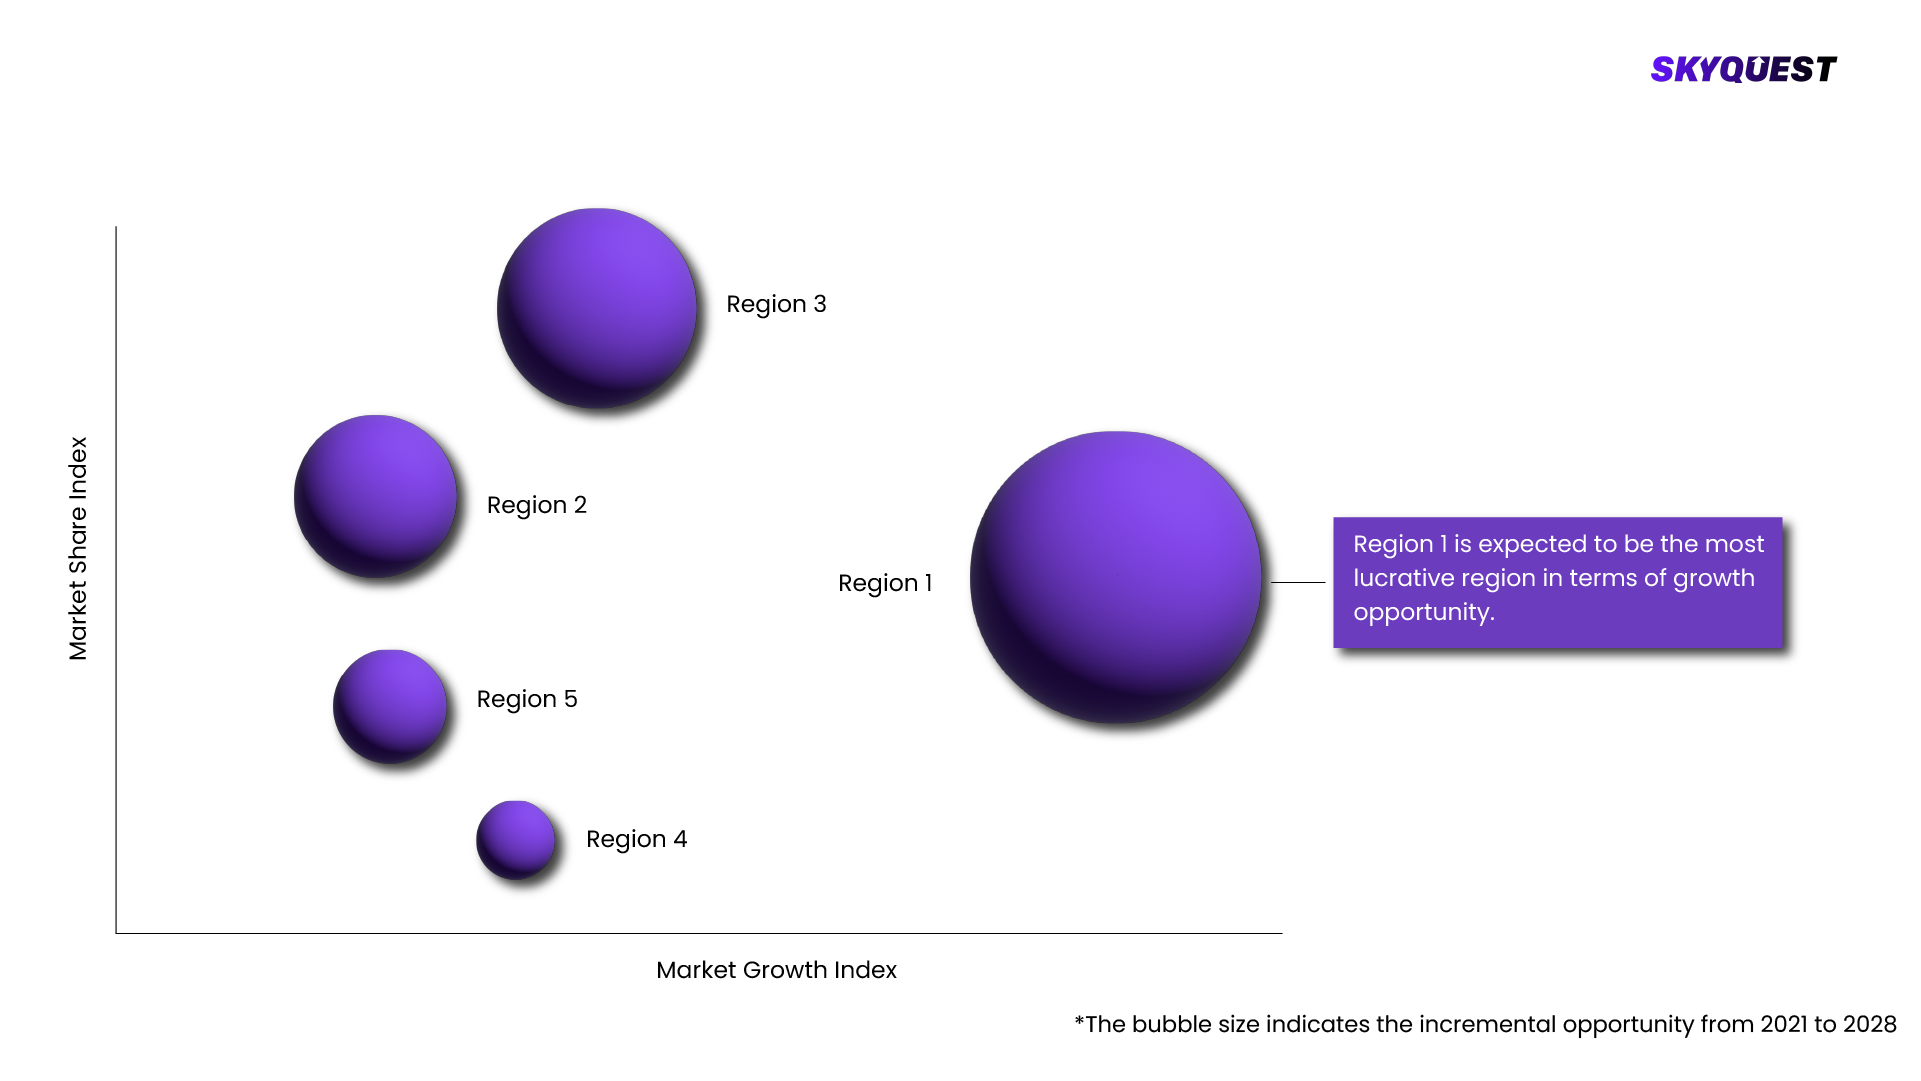
Global Over-the-top/ OTT Market By Geography, 2021 - 2028
  • Largest
  • Fastest

To know more about the market opportunities by region and country, click here to
Buy The Complete Report

Over-the-Top/OTT Market Dynamics

Over-the-Top/OTT Market Driver

  • OTT market is gaining momentum in recent times due to its demand in emerging economies. Wide availability of content, increasing SVoD services, live streaming channels, gaming during lockdown and availability of freemium models are some of the factors bolstering demand for the market.
  • The demand for new OTT entertainment material has increased significantly, and a growing number of OTT service providers are making some of the existing content available for free and launching new content on their platform. To meet the ever-increasing demand of consumers, platforms like Zee5 and Amazon Prime Video have given a handful of their episodes free to watch as part of their #BeCalmBeEntertained initiative. Furthermore, the Zee5 platform, an Indian OTT service provider, has seen a nearly 80% spike in memberships and a more than 50% increase in time spent recently. Furthermore, Amazon Prime Video has made some of its children's entertainment available for free in India.

Over-the-Top/OTT Market Restraint

  • One of the fastest expanding application areas is online gaming. However, Companies in this area use OTT services to successfully release and deliver games online, with scalability for many players in different places. For gaming content, they desire HD resolution. A lack of high-quality gaming material, combined with poor web performance, slow frame rates, poor visuals, and unpleasant webpage latency times, might reduce the number of online customers for gaming companies.

Request Free Customization of this report to help us to meet your business objectives.

Over-the-Top/OTT Market Competitive Landscape

The global markets are characterized by a fragmented landscape and fierce competition among industry participants. The players have focused their efforts on bolstering their market position through mergers and acquisitions, alliances, and global development. These techniques assist businesses in expanding their geographic reach and improving their service offerings in both domestic and foreign markets.

The expansion of smart devices, broadband, and internet access, together with the introduction of new technologies such as 5G, 4G, robust payment infrastructure, and a dynamic local content ecosystem, is propelling the Over-the-Top/OTT Services Market ahead.

Over-the-Top/OTT Market Top Players Company Profiles

  • Netflix
  • Amazon
  • Microsoft
  • Disney+ Hotstar
  • Hulu
  • YouTube TV
  • Apple TV+
  • HBO Max
  • Peacock TV
  • Sling TV
  • Fubo TV
  • ESPN+
  • CBS All Access
  • Vimeo
  • DAZN
  • Crunchyroll
  • Vudu
  • Tubi TV
  • Sony Liv
  • Zee5
  • Stan

Over-the-Top/OTT Market Recent Developments

  • In May 2022, PVR Ltd and Inox Leisure Ltd, two major multiplex chains, have announced a combination to resist the assault of Over-the-Top/OTT (OTT) content.
  • In April 2022, At NAB 2022, TvStartup Inc. unveiled an innovative new OTT video management platform.
  • In January 2021, IndieFlix, founded in Seattle, is extending its programming with videos for young people regarding mental health.
  • In August 2021, At NAB 2022, TvStartup Inc. unveiled an innovative new OTT video management platform.

Over-the-Top/OTT Key Market Trends

  • More live streaming channels are expected to be offered by OTT operators in the future. Furthermore, OTT content will undergo a significant transition, with breaking news hitting Periscope, Facebook Live, and possibly YouTube. Broadcasters in the US are cooperating with multichannel video programming distributors (MVPDs) to provide a ready version of live and linear feeds that may be bundled as OTT products, supporting industry growth.
  • As the COVID-19 pandemic began and the lockdown was enacted, live content streaming rose dramatically, which is beneficial to the market. For instance, the live-streaming sector expanded by 45% between March and April of 2020, and these gains are directly related to the coronavirus outbreak. Furthermore, viewers are live streaming Twitch concerts, zoom lectures, business meetings, and virtual book launches, which is likely to supply the market with profitable opportunities.
  • A major reason behind the increasing adoption of OTT is the reduced content of calories and carbohydrates in comparison to beers and other drinks. Market penetration is also given a boost mainly due to marketing campaigns. The product packaging and design are vital as these are inspired by the sparkling water that forms the product’s core and reflects the refreshing lightness of seltzers. The bold colourfulness represents the full fruit flavour of the product, hence attracting customers. This market thrives on user experience and research to produce new tastes and consumer behaviour.

Over-the-Top/OTT Market SkyQuest Analysis

SkyQuest’s ABIRAW (Advanced Business Intelligence, Research & Analysis Wing) is our Business Information Services team that Collects, Collates, Co-relates and Analyses the Data collected by means of Primary Exploratory Research backed by the robust Secondary Desk research.

As per our analysis, the Global Over-the-Top/OTT Market is growing due to factors such as an increase in demand for OTT services in developing regions, an increase in SVoD services, the availability of a wide range of content, a surge in demand for live streaming channels, an increase in demand for OTT services and gaming during the COVID-19 lockdown period, and the availability of freemium models in price-sensitive markets. However, the emergence of new OTT markets and technological advancements in OTT is expected to have a significant impact on market growth. The market's growth is also hindered by the lack of data network infrastructure and latency issues. However, each of these factors is expected to have a significant impact on market growth over the forecast period.

Report Metric Details
Market size value in 2019 USD 150.51 billion
Market size value in 2031 USD 1241.6 billion
Growth Rate 26.42%
Base year 2023
Forecast period 2024-2031
Forecast Unit (Value) USD Billion
Segments covered
  • Device Type
    • Smartphones & Tablets, Desktops & Laptops, and IPTV & Consoles
  • Content Type
    • Video, Audio/VoIP, Games, and Communication
  • Revenue Model
    • Subscription, Advertisement, Transaction
  • End-User
    • Media & Entertainment, Education & Learning, Autonomous driving, Gaming, and Service Utilities
Regions covered North America (US, Canada), Europe (Germany, France, United Kingdom, Italy, Spain, Rest of Europe), Asia Pacific (China, India, Japan, Rest of Asia-Pacific), Latin America (Brazil, Rest of Latin America), Middle East & Africa (South Africa, GCC Countries, Rest of MEA)
Companies covered
  • Netflix
  • Amazon
  • Microsoft
  • Disney+ Hotstar
  • Hulu
  • YouTube TV
  • Apple TV+
  • HBO Max
  • Peacock TV
  • Sling TV
  • Fubo TV
  • ESPN+
  • CBS All Access
  • Vimeo
  • DAZN
  • Crunchyroll
  • Vudu
  • Tubi TV
  • Sony Liv
  • Zee5
  • Stan
Customization scope

Free report customization with purchase. Customization includes:-

  • Segments by type, application, etc
  • Company profile
  • Market dynamics & outlook
  • Region

To get a free trial access to our platform which is a one stop solution for all your data requirements for quicker decision making. This platform allows you to compare markets, competitors who are prominent in the market, and mega trends that are influencing the dynamics in the market. Also, get access to detailed SkyQuest exclusive matrix.

Buy The Complete Report to read the analyzed strategies adopted by the top vendors either to retain or gain market share

Table Of Content

Executive Summary

Market overview

  • Exhibit: Executive Summary – Chart on Market Overview
  • Exhibit: Executive Summary – Data Table on Market Overview
  • Exhibit: Executive Summary – Chart on Over-the-Top/OTT Market Characteristics
  • Exhibit: Executive Summary – Chart on Market by Geography
  • Exhibit: Executive Summary – Chart on Market Segmentation
  • Exhibit: Executive Summary – Chart on Incremental Growth
  • Exhibit: Executive Summary – Data Table on Incremental Growth
  • Exhibit: Executive Summary – Chart on Vendor Market Positioning

Parent Market Analysis

Market overview

Market size

  • Market Dynamics
    • Exhibit: Impact analysis of DROC, 2021
      • Drivers
      • Opportunities
      • Restraints
      • Challenges
  • SWOT Analysis

KEY MARKET INSIGHTS

  • Technology Analysis
    • (Exhibit: Data Table: Name of technology and details)
  • Pricing Analysis
    • (Exhibit: Data Table: Name of technology and pricing details)
  • Supply Chain Analysis
    • (Exhibit: Detailed Supply Chain Presentation)
  • Value Chain Analysis
    • (Exhibit: Detailed Value Chain Presentation)
  • Ecosystem Of the Market
    • Exhibit: Parent Market Ecosystem Market Analysis
    • Exhibit: Market Characteristics of Parent Market
  • IP Analysis
    • (Exhibit: Data Table: Name of product/technology, patents filed, inventor/company name, acquiring firm)
  • Trade Analysis
    • (Exhibit: Data Table: Import and Export data details)
  • Startup Analysis
    • (Exhibit: Data Table: Emerging startups details)
  • Raw Material Analysis
    • (Exhibit: Data Table: Mapping of key raw materials)
  • Innovation Matrix
    • (Exhibit: Positioning Matrix: Mapping of new and existing technologies)
  • Pipeline product Analysis
    • (Exhibit: Data Table: Name of companies and pipeline products, regional mapping)
  • Macroeconomic Indicators

COVID IMPACT

  • Introduction
  • Impact On Economy—scenario Assessment
    • Exhibit: Data on GDP - Year-over-year growth 2016-2022 (%)
  • Revised Market Size
    • Exhibit: Data Table on Over-the-Top/OTT Market size and forecast 2021-2027 ($ million)
  • Impact Of COVID On Key Segments
    • Exhibit: Data Table on Segment Market size and forecast 2021-2027 ($ million)
  • COVID Strategies By Company
    • Exhibit: Analysis on key strategies adopted by companies

MARKET DYNAMICS & OUTLOOK

  • Market Dynamics
    • Exhibit: Impact analysis of DROC, 2021
      • Drivers
      • Opportunities
      • Restraints
      • Challenges
  • Regulatory Landscape
    • Exhibit: Data Table on regulation from different region
  • SWOT Analysis
  • Porters Analysis
    • Competitive rivalry
      • Exhibit: Competitive rivalry Impact of key factors, 2021
    • Threat of substitute products
      • Exhibit: Threat of Substitute Products Impact of key factors, 2021
    • Bargaining power of buyers
      • Exhibit: buyers bargaining power Impact of key factors, 2021
    • Threat of new entrants
      • Exhibit: Threat of new entrants Impact of key factors, 2021
    • Bargaining power of suppliers
      • Exhibit: Threat of suppliers bargaining power Impact of key factors, 2021
  • Skyquest special insights on future disruptions
    • Political Impact
    • Economic impact
    • Social Impact
    • Technical Impact
    • Environmental Impact
    • Legal Impact

Market Size by Region

  • Chart on Market share by geography 2021-2027 (%)
  • Data Table on Market share by geography 2021-2027(%)
  • North America
    • Chart on Market share by country 2021-2027 (%)
    • Data Table on Market share by country 2021-2027(%)
    • USA
      • Exhibit: Chart on Market share 2021-2027 (%)
      • Exhibit: Market size and forecast 2021-2027 ($ million)
    • Canada
      • Exhibit: Chart on Market share 2021-2027 (%)
      • Exhibit: Market size and forecast 2021-2027 ($ million)
  • Europe
    • Chart on Market share by country 2021-2027 (%)
    • Data Table on Market share by country 2021-2027(%)
    • Germany
      • Exhibit: Chart on Market share 2021-2027 (%)
      • Exhibit: Market size and forecast 2021-2027 ($ million)
    • Spain
      • Exhibit: Chart on Market share 2021-2027 (%)
      • Exhibit: Market size and forecast 2021-2027 ($ million)
    • France
      • Exhibit: Chart on Market share 2021-2027 (%)
      • Exhibit: Market size and forecast 2021-2027 ($ million)
    • UK
      • Exhibit: Chart on Market share 2021-2027 (%)
      • Exhibit: Market size and forecast 2021-2027 ($ million)
    • Rest of Europe
      • Exhibit: Chart on Market share 2021-2027 (%)
      • Exhibit: Market size and forecast 2021-2027 ($ million)
  • Asia Pacific
    • Chart on Market share by country 2021-2027 (%)
    • Data Table on Market share by country 2021-2027(%)
    • China
      • Exhibit: Chart on Market share 2021-2027 (%)
      • Exhibit: Market size and forecast 2021-2027 ($ million)
    • India
      • Exhibit: Chart on Market share 2021-2027 (%)
      • Exhibit: Market size and forecast 2021-2027 ($ million)
    • Japan
      • Exhibit: Chart on Market share 2021-2027 (%)
      • Exhibit: Market size and forecast 2021-2027 ($ million)
    • South Korea
      • Exhibit: Chart on Market share 2021-2027 (%)
      • Exhibit: Market size and forecast 2021-2027 ($ million)
    • Rest of Asia Pacific
      • Exhibit: Chart on Market share 2021-2027 (%)
      • Exhibit: Market size and forecast 2021-2027 ($ million)
  • Latin America
    • Chart on Market share by country 2021-2027 (%)
    • Data Table on Market share by country 2021-2027(%)
    • Brazil
      • Exhibit: Chart on Market share 2021-2027 (%)
      • Exhibit: Market size and forecast 2021-2027 ($ million)
    • Rest of South America
      • Exhibit: Chart on Market share 2021-2027 (%)
      • Exhibit: Market size and forecast 2021-2027 ($ million)
  • Middle East & Africa (MEA)
    • Chart on Market share by country 2021-2027 (%)
    • Data Table on Market share by country 2021-2027(%)
    • GCC Countries
      • Exhibit: Chart on Market share 2021-2027 (%)
      • Exhibit: Market size and forecast 2021-2027 ($ million)
    • South Africa
      • Exhibit: Chart on Market share 2021-2027 (%)
      • Exhibit: Market size and forecast 2021-2027 ($ million)
    • Rest of MEA
      • Exhibit: Chart on Market share 2021-2027 (%)
      • Exhibit: Market size and forecast 2021-2027 ($ million)

KEY COMPANY PROFILES

  • Competitive Landscape
    • Total number of companies covered
      • Exhibit: companies covered in the report, 2021
    • Top companies market positioning
      • Exhibit: company positioning matrix, 2021
    • Top companies market Share
      • Exhibit: Pie chart analysis on company market share, 2021(%)

Methodology

For the Over-the-Top/OTT Market, our research methodology involved a mixture of primary and secondary data sources. Key steps involved in the research process are listed below:

1. Information Procurement: This stage involved the procurement of Market data or related information via primary and secondary sources. The various secondary sources used included various company websites, annual reports, trade databases, and paid databases such as Hoover's, Bloomberg Business, Factiva, and Avention. Our team did 45 primary interactions Globally which included several stakeholders such as manufacturers, customers, key opinion leaders, etc. Overall, information procurement was one of the most extensive stages in our research process.

2. Information Analysis: This step involved triangulation of data through bottom-up and top-down approaches to estimate and validate the total size and future estimate of the Over-the-Top/OTT Market.

3. Report Formulation: The final step entailed the placement of data points in appropriate Market spaces in an attempt to deduce viable conclusions.

4. Validation & Publishing: Validation is the most important step in the process. Validation & re-validation via an intricately designed process helped us finalize data points to be used for final calculations. The final Market estimates and forecasts were then aligned and sent to our panel of industry experts for validation of data. Once the validation was done the report was sent to our Quality Assurance team to ensure adherence to style guides, consistency & design.

Analyst Support

Customization Options

With the given market data, our dedicated team of analysts can offer you the following customization options are available for the Over-the-Top/OTT Market:

Product Analysis: Product matrix, which offers a detailed comparison of the product portfolio of companies.

Regional Analysis: Further analysis of the Over-the-Top/OTT Market for additional countries.

Competitive Analysis: Detailed analysis and profiling of additional Market players & comparative analysis of competitive products.

Go to Market Strategy: Find the high-growth channels to invest your marketing efforts and increase your customer base.

Innovation Mapping: Identify racial solutions and innovation, connected to deep ecosystems of innovators, start-ups, academics, and strategic partners.

Category Intelligence: Customized intelligence that is relevant to their supply Markets will enable them to make smarter sourcing decisions and improve their category management.

Public Company Transcript Analysis: To improve the investment performance by generating new alpha and making better-informed decisions.

Social Media Listening: To analyze the conversations and trends happening not just around your brand, but around your industry as a whole, and use those insights to make better Marketing decisions.

$5,300
BUY NOW

REQUEST FOR SAMPLE

Want to customize this report?
REQUEST FREE CUSTOMIZATION

FAQs

Over-the-Top/OTT Market size was valued at USD 150.51 billion in 2019 and is poised to grow from USD 190.32 billion in 2023 to USD 1241.6 billion by 2031, growing at a CAGR of 26.42% in the forecast period (2024-2031).

The markets are characterized by a fragmented landscape and fierce competition among industry participants. The players have focused their efforts on bolstering their market position through mergers and acquisitions, alliances, and development. These techniques assist businesses in expanding their geographic reach and improving their service offerings in both domestic and foreign markets. 'Netflix', 'Amazon', 'Microsoft', 'Disney+ Hotstar', 'Hulu', 'YouTube TV', 'Apple TV+', 'HBO Max', 'Peacock TV', 'Sling TV', 'Fubo TV', 'ESPN+', 'CBS All Access', 'Vimeo', 'DAZN', 'Crunchyroll', 'Vudu', 'Tubi TV', 'Sony Liv', 'Zee5', 'Stan'

OTT market is gaining momentum in recent times due to its demand in emerging economies. Wide availability of content, increasing SVoD services, live streaming channels, gaming during lockdown and availability of freemium models are some of the factors bolstering demand for the market.

More live streaming channels are expected to be offered by OTT operators in the future. Furthermore, OTT content will undergo a significant transition, with breaking news hitting Periscope, Facebook Live, and possibly YouTube. Broadcasters in the US are cooperating with multichannel video programming distributors (MVPDs) to provide a ready version of live and linear feeds that may be bundled as OTT products, supporting industry growth.

North America accounted for a noteworthy share of the market. In the US, 64 million homes are using OTT, with an average once-a-month viewing value of more than 80 hours of OTT data. Furthermore, OTT content types mostly related to education, games, and entertainment are seeing increased developments, with more than 60% reach among homes with Wi-Fi. The use of Over-the-Top/OTT (OTT) in sports is getting more widespread. Rising content gaining expenditure throughout this area proves how many companies are incoming the OTT field.

Request Free Customization

Want to customize this report? This report can be personalized according to your needs. Our analysts and industry experts will work directly with you to understand your requirements and provide you with customized data in a short amount of time. We offer $1000 worth of FREE customization at the time of purchase.

logo-images

Feedback From Our Clients

Over-the-Top/OTT Market

Report ID: SQMIG50I2003

sales@skyquestt.com
USA +1 351-333-4748

BUY NOW GET FREE SAMPLE